Also called: Gantt Diagram, Gantt Project Plan, Gantt Schedule, Gantt Timeline, Bar Chart, Bar Graph, Project Bar Chart, and Project Schedule Chart
See also: Action Priority Matrix, Agile Product Owner, Agile Program Management Office, Product Delivery, Product Manager
Relevant metrics: Project Completion Rate, Cost Performance Index, Schedule Performance Index, Resource Utilization, and Quality of Deliverables
What is a Gantt Chart?
A Gantt Chart is a type of bar chart used to illustrate a project schedule. The chart is composed of a series of horizontal bars that represent tasks or activities, and the length of each bar is proportional to the duration of the task or activity. The chart also includes a timeline along the top of the chart, which is used to indicate the start and end dates of each task or activity.
Gantt charts are used to plan, coordinate, and track specific tasks in a project. They are also used to visualize the timeline of a project, and to identify potential problems or delays. Gantt charts are now widely used in project management, and are considered to be one of the most effective tools for managing complex projects
They depicts the progress of work completed over a specific period of time in relation to the time planned for it. They usually comprise two sections - the left side includes a list of tasks while the right side has a timeline with scheduled bars visualizing work. They also display the start and end dates of tasks, assignees, milestones, and dependencies between tasks.
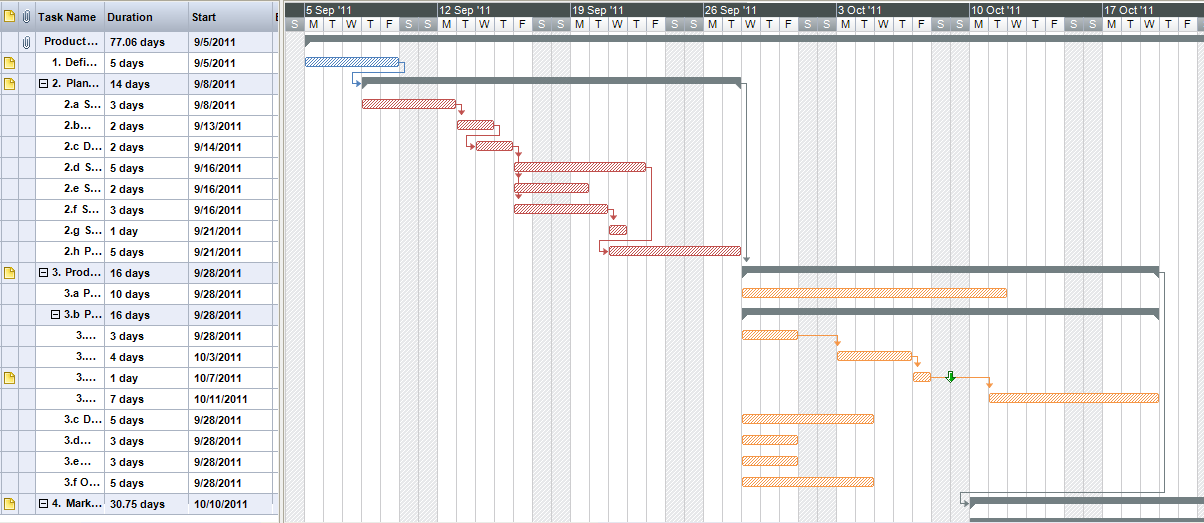
Modern Gantt charts also display the dependency relationships between activities, allowing project managers to track progress easily. They can also show the current status of the schedule by using percent-complete shading and a vertical “TODAY” line.
Gantt charts are sometimes mistaken for bar charts, but they are different in the sense that Gantt charts display the interdependencies between tasks. Gantt charts are generally created using the early start time approach, where each task is scheduled to start immediately when its prerequisites are complete. This method maximizes the float time available for all tasks.
Where do Gantt Charts originate from?
Gantt charts were developed by Henry Gantt in the early 20th century as a visual tool to display project schedules. Gantt was a mechanical engineer and management consultant who worked with Frederick Winslow Taylor, the father of scientific management. Gantt was interested in finding ways to improve efficiency and productivity in manufacturing, and he developed the Gantt chart as a tool to help managers plan and monitor production schedules.
The first Gantt chart was used in 1917 during the First World War to track the production of weapons in US factories. Gantt was hired by the US government to help improve the production process, and he used his charts to show how different parts of the production process were interconnected and how delays in one area could affect the entire process.
Gantt charts gained popularity in the 1920s and 1930s as a tool for scheduling and tracking work in large construction and engineering projects. The charts were particularly useful for managing complex projects with many different tasks and dependencies.
In the 1950s and 1960s, as project management became more formalized as a discipline, Gantt charts became a standard tool for project planning and scheduling. Today, Gantt charts are widely used in project management and other fields to help visualize complex schedules and track progress towards goals.
What are Gantt charts used for?
Gantt charts are widely used project management tools that help visualize and organize complex projects into smaller, manageable tasks. They allow managers to plan and schedule projects, allocate resources, track progress, and ensure the timely execution of critical tasks. Here are some ways that Gantt charts can be used:
Managing milestones and deadlines
Milestones are critical points in the project’s progress, such as financial checks, external inspections, and meetings. Gantt charts can be used to manage these milestones and deadlines by displaying how much work the team has done and how much is left. Reviewing progress regularly leading up to a milestone helps determine if the project is on track, and managers can adjust the schedule or provide extra resources if tasks are behind schedule.
Breaking projects into smaller tasks
Gantt charts help break down big projects into smaller, more manageable tasks. Managers can work backwards from each milestone to determine the big-picture processes or sets of work required to achieve them, and then break each of these down into smaller, individual tasks. Analyzing each task helps determine the resources and time required, and identifying complex tasks that require more time can lead to breaking them down into smaller subtasks.
Visualizing task dependencies
Modern projects involve multiple team members working on interlinking tasks, called dependencies. Gantt charts can help visualize these dependencies and the order in which tasks need to be done. Tasks can be linked with arrows, showing which tasks need to be completed before others can begin.
Monitoring project progress
Gantt charts can help track the progress of each task at all times, ensuring that there are no delays in critical tasks. The bars on the chart can be used to show which tasks are complete and which are delayed, and the percentage of completion can be shown by gradually filling in the task’s bar.
Benefits of Gantt Charts for Project Management
Easier Time Management at Every Level
Gantt charts provide a single view of the entire project, allowing every member of the team to be a part of the scheduling process. Project managers schedule tasks and subtasks and define dependencies while individual members use them to communicate their progress and share difficulties. Getting every team member on the same page, with a deep understanding of task relationships, leads to a project’s timely success.
Strategic View of Dependencies
Gantt charts help avoid delays and bottlenecks by displaying overlapping tasks and dependencies. This means you can react to delays and reassign resources as needed to make sure dependencies don’t become bottlenecks. For example, a manager can lengthen the Task A bar on the Gantt chart if there are delays finishing the building structure, and when it starts to overlap the Task B bar, the project manager immediately realizes they need to reschedule the door and window fitting, be aware of overtime requests, and get ready for project delays.
Simpler Project Planning
Gantt charts provide a detailed overview of your project, making planning work much simpler. Gantt charts allow you to identify the critical path through your project, which includes the longest tasks on your chart. These are critical because any delay completing them will have the biggest repercussions for the rest of your project. Gantt charts clearly show which tasks are the longest and should be prioritized in your planning.
Improved Transparency
Gantt charts are accessible to everyone on your team, and it’s clear who’s responsible for what, which increases teamwork and accountability. Visualizing the project in one place creates greater transparency and trust between team members. For example, Gantt charts clearly show who is responsible for a task, so everyone can see if someone is at risk of missing a deadline.
Greater Accountability
Gantt charts increase accountability, as the team knows when a particular task is holding the project up, so individuals naturally try to avoid being the one responsible for any delay. And team members who achieve milestones ahead of schedule get the recognition they deserve for their hard work.
Better Resource Allocation
Gantt charts help avoid giving too much work to one employee, as it’s easy to spot when someone is responsible for too much of a project or is working on too many concurrent tasks. You can react to these issues, delegate, and reassign resources to keep the project on schedule and your team members healthy and happy.
Increased Flexibility
Gantt charts make it easy to alter your strategy, resources, or tasks in the middle of a project, as you can see where changes can be made and what effect they will have on the team and the project as a whole. Gantt chart software lets you reschedule resources, reassign tasks, and change dependencies with just a few clicks.
More Productive Remote Teams
Gantt charts are an excellent tool for remote team management, as they provide one unified project timeline that is accessible from anywhere. Team members can see they’re part of a team and that they’re achieving milestones with coworkers, despite being physically removed from each other. This makes Gantt charts a great remote management tool and a terrific motivator for the team.
Gantt charts and the Waterfall Model
Gantt charts and the waterfall model are a great match due to their linear and sequential approach. In the waterfall model, all requirements are gathered at the beginning of the project, and the project plan is created in sequential order, with each task depending on the completion of the previous one. Gantt charts are perfect for waterfall project management, as they help in scheduling the project by breaking it down into smaller, manageable chunks of work and assigning start and end dates. This allows project managers to track the progress of the project in a visual way and to identify important milestones.
However, the waterfall model has its downsides. The linear approach makes it difficult to backtrack to previous phases if changes are necessary, and roadblocks or delays can have a significant impact on the timeline. Quality assurance (QA) also happens later in the process, making it harder to correct mistakes made earlier.
Gantt charts and Agile
In contrast to the waterfall model, agile project management focuses on flexibility and adaptability. Agile teams break the project into smaller iterations or sprints, with the plan for each sprint created at the beginning. Stakeholder feedback is an essential part of the agile methodology, and changes are expected throughout the project.
While Gantt charts can still be helpful for agile teams, their usefulness is limited. Agile teams require constant flexibility and change, and the effort and time needed to update a Gantt chart almost continuously would be an unnecessary and unrealistic burden. Therefore, Gantt charts are not recommended for use in an agile context. Instead, agile teams rely on other visual aids, such as kanban boards, to track progress and prioritize tasks.
What are the components of a Gantt chart?
A Gantt chart is typically composed of the following components:
- Tasks or activities. These are the individual activities that make up the project. They can be shown as bars or blocks on the chart.
- Time scale. This is the horizontal axis of the chart that represents the duration of the project. The time scale can be displayed in days, weeks, months, or even years.
- Milestones. These are significant events or achievements in the project that are marked with a specific symbol on the chart, such as a diamond.
- Dependencies. These are the relationships between the tasks that determine their order of execution. Dependencies are shown as lines or arrows that connect the tasks.
- Resources. These are the people or materials needed to complete the tasks. Resource information can be included in the chart to show which resources are assigned to which tasks and when.
- Progress tracking. This is the ability to track the progress of the project against the planned schedule. The actual progress is typically shown as a line or shaded area on the chart, while the planned schedule is shown as bars or blocks.
How do I create a Gantt chart?
Creating a Gantt chart can be done using various software tools such as Microsoft Excel, Microsoft Project, or specialized project management software. Here are the general steps to create a Gantt chart:
- Identify the tasks and their dependencies. List out all the tasks needed to complete the project, and then determine the dependencies between them. The dependencies will help you decide which tasks need to be completed before others can begin.
- Determine the task duration. Estimate how long each task will take to complete. It is important to be realistic and consider any constraints, such as limited resources or availability.
- Create a timeline. Create a timeline that spans the entire duration of the project. Divide the timeline into smaller intervals, such as weeks or days, depending on the project’s duration.
- Plot the tasks. Plot each task on the timeline, using a horizontal bar to represent its duration. Make sure to position each bar according to the task’s start and end dates.
- Add dependencies. Use arrows or lines to show the dependencies between tasks. For example, if task B cannot start until task A is completed, draw an arrow from task A to task B.
- Add milestones. Add important milestones to the chart, such as project deadlines, key deliverables, or major events.
- Customize the chart. Customize the chart by adding labels, colors, or other visual elements to make it easier to read and understand.
- Review and update. Review the Gantt chart regularly to monitor progress and update it as needed. This will help ensure that the project stays on track and that any changes or delays are reflected in the chart.
-
What is the purpose of the Gantt Chart?
Hint The purpose of the Gantt Chart is to provide a visual representation of a project's timeline, tasks, and progress. -
What tasks need to be included in the Gantt Chart?
Hint Tasks that need to be included in the Gantt Chart are the project's timeline, tasks, and milestones. -
How much detail do I need to include in the Gantt Chart?
Hint The amount of detail needed in the Gantt Chart will depend on the complexity of the project. Generally, the more detailed the Gantt Chart, the better. -
How will the Gantt Chart be used?
Hint The Gantt Chart can be used to plan, track, and manage a project's timeline, tasks, and progress. -
What timeline do I need to follow for the Gantt Chart?
Hint The timeline for the Gantt Chart should be based on the project's timeline and milestones. -
What resources do I need to create the Gantt Chart?
Hint Resources needed to create the Gantt Chart include project management software, a spreadsheet program, or a Gantt Chart template. -
How will I track progress with the Gantt Chart?
Hint Progress can be tracked with the Gantt Chart by monitoring the completion of tasks and milestones. -
How will I update the Gantt Chart as tasks are completed?
Hint The Gantt Chart can be updated as tasks are completed by marking them as complete or updating the timeline. -
How will I communicate the Gantt Chart to stakeholders?
Hint The Gantt Chart can be communicated to stakeholders by sharing the chart or providing a link to the chart. -
How will I ensure the accuracy of the Gantt Chart?
Hint The accuracy of the Gantt Chart can be ensured by regularly reviewing and updating the chart as tasks are completed.
You might also be interested in reading up on:
- Project Management Tips @PMTips
- Project Management Institute @PMInstitute
- Organization and Management of Work by Henry Gantt (1919)
- Project Management: A Systems Approach to Planning, Scheduling, and Controlling by Harold Kerzner (2009)
- Gantt Chart: A Practical Approach by James Lewis (2003)
- Project Management: Best Practices by Edward Kerzner (2012)
Want to learn more?
Receive a hand picked list of the best reads on building products that matter every week. Curated by Anders Toxboe. Published every Tuesday.
No spam! Unsubscribe with a single click at any time.
Community events
Product Loop
Product Loop provides an opportunity for Product professionals and their peers to exchange ideas and experiences about Product Design, Development and Management, Business Modelling, Metrics, User Experience and all the other things that get us excited.
Join our communityMade with in Copenhagen, Denmark
Want to learn more about about good product development, then browse our product playbooks.