Engineering, Product management
RICE Scoring Model
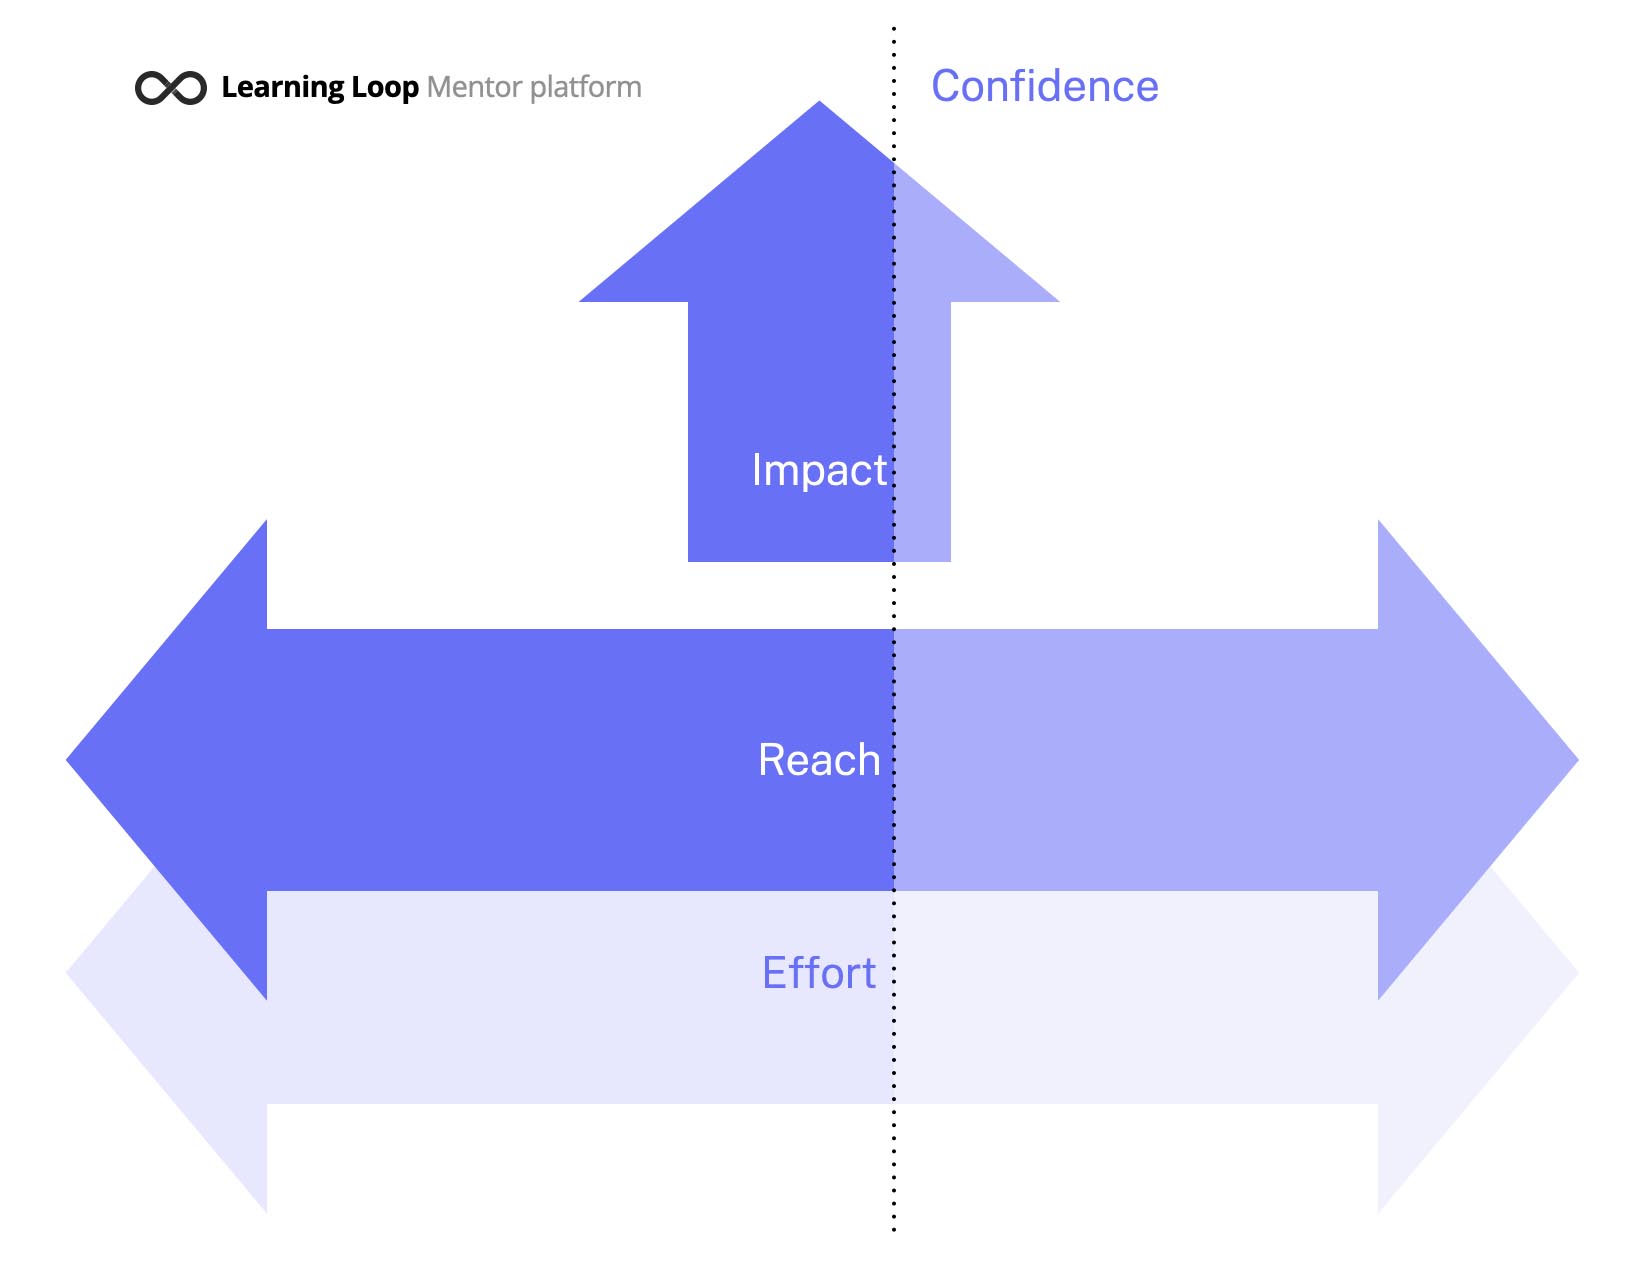
A method of prioritizing projects and tasks based on their Reach, Impact, Confidence, and Effort.
See also: Return on Time Invested, ICE Scoring Model, MoSCoW Prioritization, Weighted Shortest Job First (WSJF)
Relevant metrics: Customer Satisfaction, User Engagement, Conversion Rate, Retention Rate, Development time, and Time to market
How to calculate RICE Scoring Model:
RICE score = Reach x Impact x Confidence / Effort
What is the RICE Scoring Model?
The RICE Scoring Model is a method of evaluating potential projects and initiatives. It is a simple and straightforward system that assigns a numerical score to each project based on its Reach, Impact, Confidence, and Effort.
The score is calculated by multiplying the Reach, Impact, Confidence, and Effort scores together. The higher the score, the more attractive the initiative is. The RICE scoring model is a useful tool for organizations to quickly assess the potential value of a project or initiative and prioritize it accordingly.
Where did RICE Scoring Model come from?
The RICE scoring model was created by Des Traynor, the co-founder of Intercom, a customer messaging platform. Traynor introduced the RICE model in a blog post titled “Prioritizing Features and Tasks” on the Intercom blog in 2014. The acronym “RICE” stands for Reach, Impact, Confidence, and Effort, and the model is designed to help product managers and teams prioritize features and projects based on these criteria.
The RICE model has gained widespread popularity since its introduction, and it is now commonly used by product managers and teams in a variety of industries to make informed decisions about feature prioritization. The RICE model is particularly useful for software development and product management, as it provides a framework for evaluating potential features based on their potential impact, reach, confidence, and effort required to implement them.
How to calculate the RICE Score
To calculate the RICE score, simply multiply the values for reach, impact, and confidence, and then divide by the effort required.
Reach – Estimating the Number of People Affected
The first factor in the RICE scoring method is to get a sense of how many people you estimate your initiative will reach in a given timeframe. You can choose any time period – one month, a quarter, etc. – and you can decide that reach will refer to the number of customer transactions, free-trial signups, or how many existing users try your new feature.
Your reach score will be the number you’ve estimated. For example, if you expect your project will lead to 150 new customers within the next quarter, your reach score is 150. On the other hand, if you estimate your project will deliver 1,200 new prospects to your trial-download page within the next month, and that 30% of those prospects will sign up, your reach score is 360.
Impact – Quantifying the Effect of the Idea
The estimated impact on users or customers, measured on a scale from 1 to 10.
The impact of your idea can reflect a quantitative goal, such as how many new conversions for your project will result in when users encounter it, or a more qualitative objective such as increasing customer delight. Measuring the impact of a project can be challenging, especially if you’re using a quantitative metric like “how many people who see this feature will buy the product?” because you won’t necessarily be able to isolate your new project as the primary reason (or even a reason at all) for why your users take action.
To make things easier, Intercom developed a five-tiered scoring system for estimating a project’s impact:
3 = massive impact
2 = high impact
1 = medium impact
0.5 = low impact
0.25 = minimal impact
Confidence – The Level of Confidence in Your Estimates
The level of confidence that the team has in their estimates for reach and impact, typically measured on a scale from 1 to 10 or in percentages.
The confidence component of your RICE score helps you control for projects in which your team has data to support one factor of your score but is relying more on intuition for another factor. For example, if you have data backing up your reach estimate but your impact score represents more of a gut feeling or anecdotal evidence, your confidence score will help account for this.
When determining your confidence score for a given project, your options are:
- 100% = high confidence
- 80% = medium confidence
- 50% = low confidence
If you arrive at a confidence score below 50%, it’s best to consider it a “moonshot” and assume your priorities need to be elsewhere.
Effort – Estimating Resources Required
The estimated effort required to implement the feature or project, measured in person-months or some other unit of effort.
Effort represents the denominator in the RICE scoring equation. Quantifying effort in this model is similar to scoring reach. You simply estimate the total number of resources (product, design, engineering, testing, etc.) needed to complete the initiative over a given period of time – typically “person-months” – and that is your score.
In other words, if you estimate a project will take a total of three person-months, your effort score will be 3. Intercom scores anything less than a month as a 0.5.
Making RICE scoring work
In some cases, it may be necessary to work on projects with dependeces that are “out of order”. For instance, a project may be a prerequisite for another, or some features may be necessary to cater to specific customers. While RICE scoring can help you order all initiatives in a big priortized list, the mathemtical scoring is not the final answer, but should rather act as a valuable input to prioritization.
If the effort required for an intiative is very high, consider breaking it up into small bits.
Contrary to popular belief, RICE scores do not use mathematical alchemy to transform abstract ideas into concrete outcomes. Instead, they offer a simple exercise to break down a big idea into smaller, more manageable pieces. This makes it easier for the human mind to conceptualize the idea and avoid getting bogged down in details.
Why use RICE scoring to aid prioritization?
One of the most significant advantages of RICE scores is their ability to provide a tool for alignment. By informing stakeholders of the various factors involved in making product decisions, RICE scores can help build consensus and promote a shared understanding of priorities.
By using a prioritization framework such as RICE, product managers can achieve several benefits. These include better-informed decisions, improved alignment, and reevaluation of the metrics that define business success. RICE scores can help take emotion and opinions out of prioritization discussions and provide a more data-driven approach.
If you’re looking to enhance your prioritization process, RICE scores could be a valuable tool to explore. By enabling you to identify and rank ideas based on their potential impact and associated costs, RICE scores can provide a more data-driven approach to decision-making.
When RICE Scoring fails
Prioritization frameworks can seem like a foolproof way to score hundreds of features in a short amount of time. However, these frameworks can be dangerous because they often work on guesstimates or qualitative assessments that go into an equation. There are several problems with this approach.
The two main issues are that these are not ratio scale numbers that can be put into an equation and that what’s missing in those subjective assessments is the margin of error associated with each factor.
Why Margin of Error is Important
Margin of error is important because it affects the final result of the RICE score equation. When you multiply/divide factors each with margin of error, the total margin of error is the sum of the individual ones. Therefore, if there is a +/- 20% margin of error on each factor, you get 80% for the resulting score when using RICE. The more factors, the more potential margin of error. When you consider the lack of ratio scale numbers and ignoring Margin of Error, these frameworks have the feeling of being analytical, but in reality, they are the exact opposite.
Promoting Bottom-Up Prioritization
Frameworks such as RICE promote a bottom-up mindset, prioritizing lists of features. In reality, prioritization starts with objectives and strategy, and from there, market problems, user scenarios, and use cases, etc. By the time you get down to features, you’ve already done a lot of prioritization. Any “features” that are important shouldn’t need some multi-factor calculation to prioritize. A more strategic and future-back way of thinking is to start with a vision, objectives, and strategies to narrow down focus and then use those as guideposts to decide on specific plans to implement.
-
What is the purpose of using the RICE Scoring Model?
Hint The RICE Scoring Model is a tool used to prioritize and evaluate potential projects and initiatives based on their relative value and impact. It is used to help organizations make decisions about which projects to pursue and which to discard. -
What are the potential risks associated with using the model?
Hint Potential risks associated with using the model include the potential for misallocation of resources, inaccurate evaluation of projects, and the potential for bias in the evaluation process. -
What are the expected outcomes of using the model?
Hint The expected outcomes of using the model include improved decision-making, increased efficiency, and better resource allocation. - How will the model be adapted to changing conditions?
- What resources are needed to successfully implement the model?
- How will the model be evaluated and adjusted over time?
You might also be interested in reading up on:
- Des Traynor @destraynor
- Brian Balfour @bbalfour
- Sean Ellis @SeanEllis
- Teresa Torres @ttorres
- Rahul Vohra @rahulvohra
- Intercom on Product Management by Des Traynor (2015)
- Continuous Discovery Habits by Teresa Torres (2020)
- Inspired: How to Create Tech Products Customers Love by Marty Cagan (2008)
- Hacking Growth: How Today's Fastest-Growing Companies Drive Breakout Success by Sean Ellis and Morgan Brown (2017)
- A New System for Measuring the Performance of Health Care Organizations by David A. Berenson, The Rice Score 0 (2020)
- RICE: Simple prioritization for product managers by Sean McBride