User Experience, Product Management
HEART Framework
Google's framework for choosing user-centered metrics across Happiness, Engagement, Adoption, Retention and Task success
HEART Framework at a glance
- Type
- Framework
- Also called
- HEART Model, HEART Evaluation Framework, HEART metrics, and Google HEART framework
- See also
- Net Promoter Score (NPS)Empathy MappingImpact MappingPriority MappingUser Story MappingValue Proposition MappingProduct MetricsAARRR Pirate Metrics FrameworkRetention RateNorthstar Metric
- Metrics
-
5 relevant metrics to track
- Happiness - Attitudes such as satisfaction, perceived ease of use or likelihood to recommend
- Engagement - Frequency, intensity or depth of use, reported per user
- Adoption - New users of a product or feature in a given period
- Retention - Share of users from one period who are still active in a later period
- Task Success - Effectiveness, efficiency and error rate when completing key tasks
The HEART framework is a set of five categories of user-experience metrics (Happiness, Engagement, Adoption, Retention and Task success) that helps product teams choose a few user-centered metrics tied to their goals. Google researchers Kerry Rodden, Hilary Hutchinson and Xin Fu introduced it in 2010, together with a Goals-Signals-Metrics process for turning a goal into something you can track.
HEART doesn’t tell you which numbers to put on a dashboard. It gives you a checklist of categories to consider, so the metrics you choose say something about the people using your product rather than only about traffic or revenue.
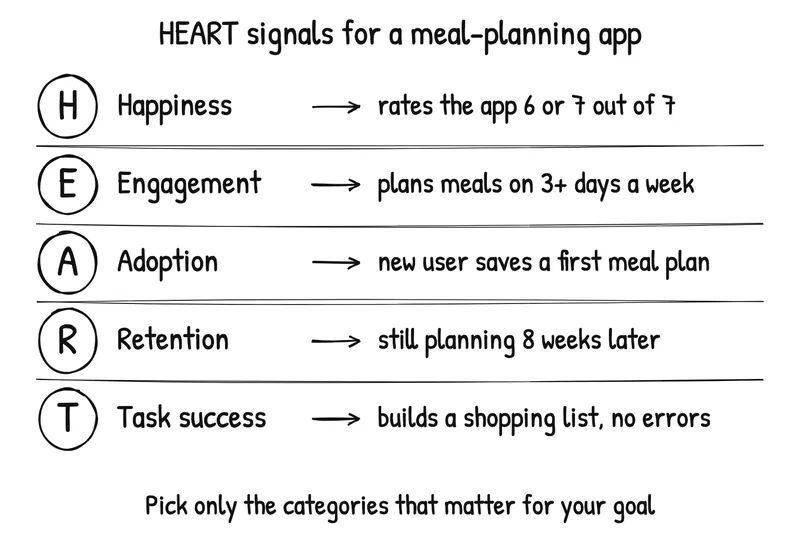
What is the HEART Framework?
The HEART framework is a set of metric categories that helps to measure and understand a product’s user experience. Its creators describe the five as categories, from which teams then define the specific metrics they will use to track progress towards their goals:
- Happiness: Attitudes such as satisfaction with the product
- Engagement: How much and how often people use the product
- Adoption: New users of the product or a feature
- Retention: Users who keep coming back over time
- Task Success: User success in completing tasks with the product
Each category provides a different aspect of a user’s experience. Happiness and Task Success generalize long-established user-experience measures. Engagement, Adoption and Retention were new categories, made possible by large-scale behavioral data.
Happiness describes metrics that are attitudinal in nature: satisfaction, visual appeal, likelihood to recommend and perceived ease of use. It is typically measured through a well-designed, regular user survey; a likelihood-to-recommend question such as the Net Promoter Score (NPS) is one option. An initial drop in happiness following a change does not necessarily have long-term implications, and long-term observation of metrics provides better data for decision-making. Google’s iGoogle team saw exactly this: satisfaction dipped after a major redesign and recovered as people got used to it.
Engagement is a measure of how much people use a product, based on behavioral data such as the frequency, intensity or depth of use over a period: the number of visits per user per week, time spent in the app, or the number of photos uploaded per user a day. The metric chosen depends on the product’s functionalities. Report it as an average per user rather than a total, because a growing total can simply mean more users, not more use.
Adoption measures how many new users start using a product or a specific feature during a given period, for example the number of accounts created in the last seven days. What counts as “using” depends on the product: for some, a visit is enough; for others, you might count someone as adopted only once they have completed a key task, such as creating an account. Adoption involves both user experience and sales and marketing activities. A heavy investment in sales and marketing can overcome user experience problems in the short run, but in the long term, a poor user experience is likely to discourage new users.
Retention measures how many of the users from a given period are still active in a later period, for example the percentage of this week’s active users who are still active three months later. It helps to identify the time interval where dropouts from a service are most pronounced, so UX issues can be addressed. Depending on the product, weekly, monthly or 90-day retention may be the right period. Adoption and Retention are especially valuable when rolling out a new product or feature, or making substantial changes to the product’s features.
Task Success measures the percentage of successful completions of a specific task once it has begun, such as checkout or registration processes. It can also examine the time spent on any given task and the error rate, and identify whether the process can be improved. Remote usability testing and benchmarking studies, where participants are given specific tasks, are recommended for measuring these on a large scale.
Where did HEART Framework come from?
The HEART Framework was developed at Google by Kerry Rodden, Hilary Hutchinson and Xin Fu, who described it in a short paper at the CHI 2010 conference, Measuring the user experience on a large scale. By then they had applied it, with the Goals-Signals-Metrics process, to more than 20 products and projects at Google.
The HEART framework was created to assist UX designers in concentrating on a few crucial user experience measurements. With various forms of usage data constantly streaming in, the framework’s creators recognized that designers could easily become overwhelmed, lacking a systematic way to assess user experience. Therefore, the HEART framework was established to help UX teams concentrate on a small set of simple-to-understand metrics.
It was also a response to what the authors called PULSE metrics: Page views, Uptime, Latency, Seven-day active users and Earnings. These matter for a product’s health, but they are low-level or indirect measures of user experience, and they can be ambiguous. A rise in page views might mean a feature is popular, or that a confusing interface makes people click around trying to escape. HEART was designed to complement PULSE with user-centered measures. The primary purpose of the framework was to narrow the focus of UX design teams to a limited number of metrics and to objectively evaluate them. This framework assists UX teams in defining user experience goals and evaluating how changes to a feature or product impact users.
How do you use the HEART framework to measure and improve user experience?
The Goals-Signals-Metrics process is used to apply the HEART framework. The Goals-Signals-Metrics (GSM) framework is used to help identify and prioritize metrics aligned with the goals. The GSM process has three elements:
- Goals are broad objectives
- Signals are indicators that show progress towards the goal
- Metrics are quantifiable data points that indicate success or failure.
The Goals-Signals-Metrics (GSM) Framework
The GSM framework is a UX measurement framework that focuses on setting clear goals, identifying signals that indicate user behavior, and choosing metrics that can be used to measure progress towards these goals. It was developed by the same Google team that created HEART, Kerry Rodden, Hilary Hutchinson and Xin Fu, and published in the same 2010 paper. It has since become a widely used method for measuring UX.
Goals
The first step in the GSM framework is to define the goals of the product or service, especially in terms of user experience. What tasks do users need to accomplish? What is the redesign trying to achieve? Use the HEART categories as prompts: is it more important to attract new users, or to encourage existing users to become more engaged? The authors offer three tips for this step:
- Team members may disagree about the goals. The process is an opportunity to collect the different ideas and work towards consensus, and buy-in for the chosen metrics.
- Goals for a particular project or feature may differ from those of the product as a whole.
- Don’t get distracted at this stage by worrying about whether or how you will find signals or metrics for a goal. Agree on what matters first; measurability comes in the next two steps.
Signals
The next step in the GSM framework is to identify the signals that indicate success or failure in user behavior or attitudes. What actions would show the goal had been met? What feelings or perceptions would go with success or failure? Signals can be anything from the number of clicks on a particular button to the time spent on a page. Consider your data sources too: are the relevant actions logged, and how will you gather attitudinal signals? Logs and surveys are the most common sources. Two tips:
- Choose signals that are sensitive and specific to the goal. They should move only when the user experience gets better or worse, not for unrelated reasons.
- Failure is sometimes easier to identify than success, for example abandoning a task, using “undo” or showing frustration.
Metrics
The final step in the GSM framework is to choose metrics that can be used to measure progress towards achieving the goals and track them over time. Metrics should be quantifiable, relevant, and aligned with the goals that have been set. They should also be easy to measure and track. Raw counts go up as your user base grows, so normalize them: ratios, percentages or averages per user are usually more useful. Make sure the data is accurate, for example by filtering out traffic from bots and checking that every important user action is actually logged.
Combining the GSM Framework with the HEART Framework
The HEART framework can be used in conjunction with the GSM framework to provide a comprehensive UX measurement strategy. By using the HEART metrics as a starting point, it becomes easier to identify the goals that need to be achieved. For example, if the task success metric is low, the goal may be to improve the usability of the product.
Once the goals have been identified, the GSM framework can be used to identify the signals that indicate user behavior and the metrics that can be used to measure progress towards achieving the goals. By combining these two frameworks, it becomes easier to measure UX effectively and to make data-driven decisions that lead to continuous improvement.
Example of mapping GSM to the HEART Framework
As an example for inspiration, here’s typical inputs you could use to map out the HEART framework using the Goal, Signals, Metrics process:
| HEART Acronym | Example User Goal | Example Signals | Example Metrics |
|---|---|---|---|
| Happiness | Feelings of enjoyment or delight | User satisfaction ratings | User satisfaction score (e.g., percentage of users who rate their experience as positive) |
| Engagement | Amount of user involvement with content or features | Number of visits or interactions with specific features | Visits per user per week, share of users active on several days a week |
| Adoption | Rate of new user onboarding and successful use of product features | Number of sign-ups or user activations | New users who complete a key task in their first week, number of successful feature uses |
| Retention | Ability to keep users coming back to use product over time | Number of active users over a specific period | Retention rate (e.g., percentage of users who return after first use) |
| Task Success | Ability to efficiently and effectively complete tasks | Number of errors or failures during task completion | Task success rate, time to complete task |
A worked example: choosing HEART metrics for a meal-planning app
This example is hypothetical. The product and its numbers are invented to show the reasoning, not taken from a real company.
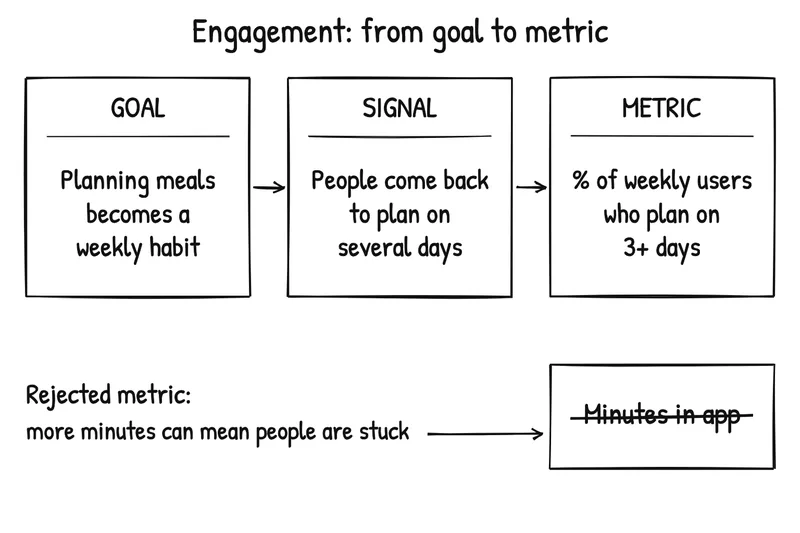
A meal-planning app is redesigning its weekly planner. The team’s goal is that planning meals becomes a weekly habit, and that the plan turns into a usable shopping list.
- Choose the categories. The team picks Engagement (do people plan regularly?), Retention (do they keep doing it?) and Task success (can they turn a plan into a shopping list?). Adoption matters less for a redesign of an existing feature, and a quarterly satisfaction survey already covers Happiness, so they leave both out on purpose.
- Find signals. Engaged users come back to plan on several days a week. Retained users are still planning weeks later. Successful users create a shopping list without deleting and re-adding items.
- Turn signals into metrics.
| Category | Goal | Signal | Metric |
|---|---|---|---|
| Engagement | Planning becomes a weekly habit | People come back to plan on several days | % of weekly active users who plan on 3+ days in the week |
| Retention | The habit lasts | People are still planning after two months | % of users active in their first week who are still active in week 8 |
| Task success | The plan becomes a shopping list | Lists are created without corrections | % of shopping lists created without an item being removed and re-added |
- Reject a tempting metric. Someone suggests total minutes in the app as the engagement metric. The team rejects it. In a planning tool, more minutes can mean people are stuck, which is the ambiguity the framework’s creators warn about with page views. They also reject the total number of plans created, because it grows with the user base; the per-user percentage above doesn’t.
- Use the metrics. The redesign ships as an A/B test, and the three metrics are compared between the old and new planner. The team agrees in advance to look at retention again after eight weeks, rather than judging the redesign on its first days, when change aversion can depress results.
HEART vs PULSE, AARRR and North Star metrics
HEART is easy to confuse with other metric frameworks, but they answer different questions. Many teams use more than one.
| Framework | What it covers | Question it answers |
|---|---|---|
| HEART | Happiness, Engagement, Adoption, Retention, Task success | Is the experience getting better for the people using it? |
| PULSE | Page views, Uptime, Latency, Seven-day active users, Earnings | Is the product healthy and running? |
| AARRR pirate metrics | Acquisition, Activation, Retention, Referral, Revenue | Where do customers drop out of the growth funnel? |
| North Star Metric | One metric that captures the value customers get | What single outcome should the whole company move? |
HEART focuses specifically on measuring the quality of the user experience. Unlike AARRR, it does not include metrics for revenue or referral. A HEART metric can, however, feed a North Star Metric, and Retention appears in both HEART and AARRR. For broader context, see product metrics.
Limitations of the HEART framework
- It’s for launched products. Its creators describe the metrics as primarily useful for evaluating launched products, and not a substitute for early or formative user research.
- Metrics shouldn’t stand alone. Triangulate them with usability studies, field studies and interviews to understand why a number moved.
- The categories don’t replace goals. Filling in all five categories without a clear goal produces a dashboard, not insight.
- Some categories may not fit. Engagement may mean little for enterprise software that people are required to use for work; Happiness or Task success may matter more there, or Engagement may still be useful at the feature level.
- Behavioral data has gaps. Logs miss actions that aren’t recorded, and traffic from bots has to be filtered out.
Using the HEART framework to improve your product
Google’s HEART framework is a helpful tool for improving product performance. Implementing the following steps using this framework will help you achieve your goals:
- Establish top goals. Prior to initiating your project, it is important to identify your key goals and have a system in place to track them.
- Use onboarding and adoption tools. Utilize a product onboarding and adoption tool to monitor progress towards goals and trigger in-app flows based on user engagement and usage. This will allow you to build in-app interactions to achieve your goals.
- Improve user happiness. The Net Promoter Score (NPS) measures user satisfaction and loyalty. To understand the reasons behind user satisfaction or dissatisfaction, conduct an NPS survey with a qualitative follow-up question.
- Analyze NPS survey responses. Analyze and tag NPS survey responses to discover what is making users happy and what issues need fixing. Group customer responses based on themes to prioritize the most common issues to resolve.
- Improve product engagement. Use different UI patterns that align with your goal to communicate with users in-app and help them engage with your product features. This includes using modal welcome screens, tooltips, and slideouts to highlight new features.
- Improve product adoption. Utilize checklists to stimulate product adoption by driving users to engage with advanced features that give them additional value.
- Improve retention. Use churn surveys to collect valuable feedback from users who downgraded or left their subscription. This feedback can be used to improve your product and drive retention up.
- Improve task success. Utilize in-app interactive guides that walk users step-by-step to complete an action. These guides contain several tooltips that trigger actions in a sequential manner to ensure task success.
When to use the HEART framework
The HEART framework is a useful tool for measuring user experience in situations where you want to evaluate the effectiveness of a product or service in meeting user needs. It can be particularly useful in the following scenarios:
- New product development. The HEART framework can help you establish a baseline for measuring user experience as you launch a new product or service.
- Iterative design. The HEART framework can be used to evaluate the impact of design changes on user experience over time, allowing you to identify which changes are most effective.
- Performance optimization. The HEART framework can help you identify areas where your product or service is underperforming in terms of user experience, allowing you to prioritize improvements.
- User research. The HEART framework can be used in conjunction with other research methods, such as surveys and interviews, to gain a more comprehensive understanding of user experience.
The HEART framework is a flexible tool that can be adapted to a wide range of situations where you want to measure user experience. Its objective is to give teams a structured approach to user experience metrics, so they can see where a product needs improvement and track the impact of changes over time.
Teams use it for several reasons: it keeps the focus on users, provides actionable insights about specific parts of the experience, offers a standard way to measure across products and platforms, gives different teams a common language, and supports better-informed product decisions.
Who uses the HEART framework?
The HEART framework can be used by various teams in an organization, particularly those involved in designing and developing products, services, or experiences for customers. This includes product managers, user experience designers, researchers, analysts, and other related roles. The framework is also useful for teams involved in evaluating and improving existing products, services, or experiences. Overall, any team that wants to measure and improve user experience can benefit from using the HEART framework.
Dedicated research teams vs cross-functional product teams
The HEART framework can be used by a dedicated research team as well as part of a cross-functional product team. In both cases, it can help teams measure and improve the user experience of their product.
If a company has a dedicated research team, they can use the HEART framework to conduct regular user research and measure the user experience over time. The research team can work with product teams to identify which metrics are most relevant for their product and set benchmarks for improvement.
On the other hand, if a company has cross-functional product teams, the HEART framework can be used to align everyone around a common set of user experience metrics. This can help ensure that everyone is working towards the same goals and that user experience is prioritized throughout the product development process.
Regardless of the team structure, the HEART framework can be a valuable tool for improving the user experience of a product.
Other ways to measure the user experience
There are various methods to measure user experience, and the choice of method depends on the specific goals and objectives of the evaluation. Here are some commonly used methods:
- Surveys. Surveys are one of the most popular methods for collecting data about user experience. They can be used to gather feedback on specific aspects of a product or service, such as ease of use, satisfaction, or perceived value.
- Interviews. Interviews involve one-on-one discussions with users and can be used to gather more detailed feedback on their experiences with a product or service. Interviews can help uncover user needs, pain points, and opportunities for improvement.
- User testing. User testing involves observing users as they interact with a product or service and can help identify usability issues and areas for improvement. This can be done in a lab setting or remotely using specialized software.
- Analytics. Analytics tools can be used to track user behavior on a website or app, such as time spent on page, clicks, and conversions. This data can help identify areas for improvement and inform design decisions.
- A/B testing. A/B testing involves testing two different versions of a product or service with a group of users to see which performs better. This can help identify the most effective design or feature and inform future development.
The choice of method depends on the specific goals and objectives of the evaluation, as well as the resources available. It’s important to use a combination of methods to get a comprehensive understanding of user experience. This is where the HEART framework shines, as it gives you a structure for combining attitudinal data from surveys with behavioral data from analytics.
HEART and UX benchmarking
UX benchmarking is a process of evaluating the user experience of a product or service by comparing it to a set of predefined metrics and industry standards. It involves collecting data on user behavior, satisfaction, and performance over time to establish a baseline for comparison and identify areas for improvement.
The HEART framework is one of the ways to establish UX benchmarks as it provides a set of user-centered metrics that can be used to measure and evaluate the user experience. By using the HEART framework, you can identify the critical aspects of the user experience, track changes in user behavior and attitudes, and assess the impact of design changes on user experience over time.
When conducting UX benchmarking, it’s essential to establish a baseline for each metric and track changes over time to identify areas for improvement. By using the HEART framework, you can establish benchmarks for each metric and track changes in user experience, making it easier to identify the areas where the product or service needs improvement.
Examples
iGoogle: Happiness after a redesign
After launching a major redesign, the iGoogle team saw an initial decline in a user-satisfaction metric from its weekly in-product survey. The metric recovered over time, which pointed to change aversion, so the team kept the new design.
Source: Rodden, Hutchinson & Fu (2010), Measuring the user experience on a large scale
Gmail: an Engagement metric
Seven-day active users only showed whether people visited at least once a week. The Gmail team chose the percentage of active users who visited on five or more days in the last week instead, and found that this metric strongly predicted longer-term retention.
Source: Rodden, Hutchinson & Fu (2010), Measuring the user experience on a large scale
Google Finance: Adoption and Retention
During the September 2008 market crash, Google Finance saw surges in page views and seven-day active users. Those numbers couldn’t say whether new users or existing users checking their investments drove the surge, so the team used Adoption and Retention metrics to separate the two groups.
Source: Rodden, Hutchinson & Fu (2010), Measuring the user experience on a large scale
Google Maps: Task success in an A/B test
Google Maps tested removing its dual “what” and “where” search box in an A/B test. Comparing error rates showed that users in the single-box version adapted their searches successfully, so the team removed the dual box for everyone.
Source: Rodden, Hutchinson & Fu (2010), Measuring the user experience on a large scale
-
Do you have to use all five HEART categories?
Hint No. Its creators note that it is not always appropriate to use metrics from every category. Use the framework to decide explicitly which categories matter for your goal, and leave out the ones that don't. -
Is HEART a set of metrics?
Hint Not exactly. HEART gives you five categories. Your team defines the specific metrics in each category, using the Goals-Signals-Metrics process to tie them to a goal. -
Who created the Goals-Signals-Metrics process?
Hint Kerry Rodden, Hilary Hutchinson and Xin Fu at Google, in the same 2010 paper that introduced HEART. -
When should you use the HEART framework?
Hint When you want to evaluate a launched product or feature with user-centered metrics, for example after a redesign or during an A/B test. It complements, but doesn't replace, early qualitative research. -
What is the difference between HEART and AARRR pirate metrics?
Hint HEART measures the quality of the user experience. AARRR (Acquisition, Activation, Retention, Referral, Revenue) follows customers through a growth funnel. Many teams use both. -
Which team should own HEART metrics?
Hint Whoever owns the product decision: often a cross-functional product team, supported by researchers or analysts who help define signals and keep metrics accurate. -
Which signal would tell you a goal was met, and which would move for unrelated reasons?
Hint Choose signals that are sensitive and specific to the goal. If a signal can also rise because of seasonality, marketing or confusion, find a better one or pair it with another measure. -
Are your metrics normalized?
Hint Raw counts grow with your user base. Prefer averages per user, ratios or percentages.
You might also be interested in reading up on:
- Tomer Sharon @tsharon
- Luke Wroblewski @LukeW
- Quantifying the User Experience: Practical Statistics for User Resea by Jeff Sauro & James R Lewis (2016)
- Rodden, K., Hutchinson, H., & Fu, X. (2010). Measuring the user experience on a large scale: User-centered metrics for web applications. Proceedings of the SIGCHI Conference on Human Factors in Computing Systems, 2395-2398.
- Measuring the User Experience on a Large Scale: User-Centered Metrics for Web Applications (Google Research) by Kerry Rodden, Hilary Hutchinson, and Xin Fu
- How Google measures and improves UX with the HEART framework (archived) by Katryna Balboni
Product Weekly · Curated by Anders Toxboe
Sign up for the Product Weekly newsletter.
Join 40,000+ product people who get a weekly selection of useful reads on building digital products, plus new Learning Loop resources and occasional product updates.
What will I receive?Takes 10 seconds. Free to subscribe, unsubscribe at any time. Privacy policy.