Idea Validation: Market demand, Willingness to pay
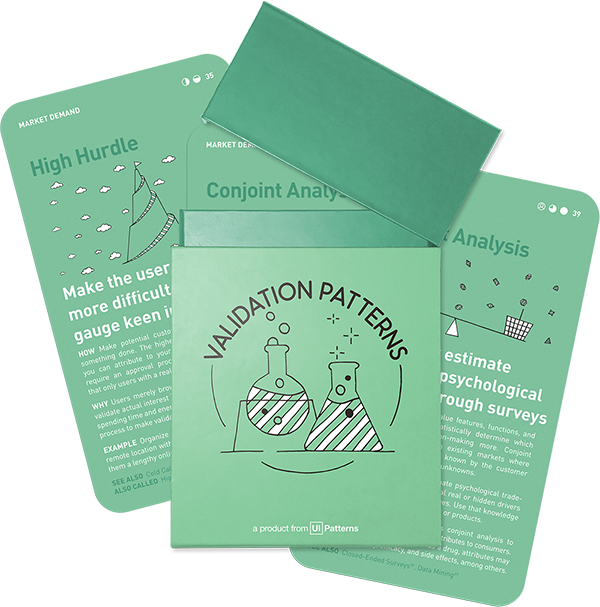
Conjoint Analysis
Statistically estimate consumers' psychological trade-offs through surveys

How: Determine how people value features, functions, and benefits of a product and statistically determine which combination influences decision-making more. Conjoint analysis is most often used in existing markets where product attributes are generally known by the customer as it's hard to determine values of unknowns.
Why: Conjoint analysis helps estimate psychological trade-offs consumers make and can reveal real or hidden drivers not apparent to consumers themselves. Use that knowledge to test specific mock-ups, prototypes, or products.
Preparing the experiment
To perform a conjoint analysis, first narrow down the top 3-5 product attributes you want to test. Choosing which attributes to test and in what priority should be qualified by generative research such as Customer Discovery Interviews as a preparation to the experiment.
The more attributes you choose to test at the same time, the more responses are needed. As a general rule of thumb, the appropriate sample size can be calculated by:
Sample size = (Total count of tested attribute values – Attribute count) · 10
By mixing all possible variations of the various attributes and its values, you will generate all product attribute variations. There are several software tools that will help you do this.
Example case
To illustrate conjoint analysis in action, consider the following example examining what kind of phone plan would sell the best (source):
| Attributes | Possible attribute values |
|---|---|
| Brand | Brand A Brand B Brand C Brand D |
| Price | $60/month $75/month $100/month |
| Minutes included | 800 1,000 1,400 2,000 |
| Rollover options | No rollover of unused minutes Unused minutes rollover for 1 month Unused minutes rollover for 1 year |
| Call options | No free calling based on contacts Free calling to top 5 contacts Free calling to top 10 contacts |
A limited number of available product variations are chosen to be presented to participants side by side. One combination of product variations for participants to choose from could look like this:
| Brand A | Brand B | Brand C |
|---|---|---|
| 1,400 minutes | 1,000 minutes | 800 minutes |
| Unused minutes rollover for 1 month | No rollover of unused minutes | Unused minutes rollover for 1 year |
| No free calling based on contacts | Free calling to top 5 contacts | Free calling to top 10 contacts |
| Costs $100/month | Costs $75/month | Costs $60/month |
To dertermine which attribute values are more powerful choice indicators, how often a product value was included in the product selected are counted and presented as the percentage of times the attribute value was included in the selected product.
For the Call options attribute, results could look like this:
| Call Options | Value |
|---|---|
| Free calling to top 10 contacts | 50% |
| Free calling to top 5 contacts | 20% |
| No free calling based on contacts | 0% |
For the Rollover options, results could look like this:
| Rollover Options | Value |
|---|---|
| Unused minutes rollover for 1 year | 100% |
| Unused minutes rollover for 1 year | 30% |
| No rollover of unused minutes | 0% |
In the example above, the Call Options had values ranging from 0 to 50 and the Rollover Options had values ranging from 0 to 100. This would indicate the Rollover Options was more important to participants than the Call Options.
Primarily used for existing markets
Conjoint analysis concerns itself about uncovering customer preferences (not actions). This is why using this methods primarily makes sense in existing markets, where product attributes are generally known by participants.
In the early stages where totally new attributes are introduced to participants, it can be hard for participants to comprehend and understand what they are choosing between. This is when results become inaccurate with the risk of producing false negatives.
This is why it makes sense to conduct significant explorative and generative research before starting a Conjoint Analysis experiment. This method is rarely used in early stage innovation products, but after product/market fit has been reached.
Two types of Conjoint analysis
In market research, two prominent methods of conjoint analysis, Discrete Choice-Based Conjoint (CBC) Analysis and Adaptive Conjoint Analysis (ACA), offer unique insights into consumer preferences and decision-making processes.
Discrete Choice-Based Conjoint (CBC) Analysis is a method where respondents are presented with several product or service options, each with varying attributes, and are asked to choose their preference. This approach mimics real-world buying scenarios, where consumers make trade-offs between different attributes like price, quality, brand, and features. CBC is particularly effective in understanding broad market trends, assessing price sensitivity, and studying how different product features interact to influence consumer choice. This methodology is advantageous when the decision-making scenario involves a limited set of key attributes and where understanding general market preferences is crucial.
Adaptive Conjoint Analysis (ACA) offers a more personalized survey experience. Unlike CBC, where all respondents see the same set of options, ACA adapts the questions based on the respondent’s previous answers. This method is suited for scenarios where products or services have a large number of attributes, and detailed insights into individual consumer preferences are crucial. ACA is especially useful for custom product development, where understanding the nuanced preferences of each consumer can guide personalized product or service offerings.
The choice between CBC and ACA largely depends on the specific objectives of the market research. CBC is the go-to method when the focus is on understanding general market trends, price sensitivity, and preference trade-offs between a few key attributes. It’s suitable for studies aimed at optimizing product features or pricing strategies for a broader market. In contrast, ACA is more appropriate when the research requires in-depth insights into individual consumer preferences, particularly when dealing with a large number of product attributes. It is ideal for businesses focusing on customized products or services where individual preferences significantly influence the product development strategy.
Use cases for Conjoin Analysis
This method is useful in several situations.
Feature Prioritization
When developing or updating products, deciding which features to include can be challenging. Conjoint analysis helps in prioritizing these features based on how much they contribute to the overall value perceived by the customers. This approach ensures that the most valuable features from the consumer’s perspective are included, enhancing product appeal and customer satisfaction.
Pricing Strategy
Conjoint analysis is highly effective for pricing optimization. Companies can gauge how price changes impact consumer choice and determine the optimal price point for their products or services. By including price as one of the attributes in the study, businesses can understand the price elasticity of their products and identify the price range that maximizes both sales volume and profit margins.
Market Segmentation
Conjoint analysis aids in market segmentation by revealing different preference patterns among various consumer groups. By understanding these patterns, businesses can segment their market more effectively, tailoring their products, marketing efforts, and services to meet the distinct needs of each segment. This targeted approach can lead to more efficient use of marketing resources and higher customer satisfaction.
Competitive Analysis
In competitive markets, understanding how your products or services stack up against competitors is vital. Conjoint analysis can simulate competitive market scenarios, helping businesses understand their competitive position. This method can reveal how changes in product features or pricing might shift consumer preferences between different brands, providing valuable insights for strategic planning.
Sales and Distribution Strategy
Conjoint analysis can also inform sales and distribution strategies. By understanding consumer preferences, companies can make informed decisions about which products to stock in which locations, how to display products in stores, and which channels (online vs. brick-and-mortar) might be most effective for different products.
Customer Needs Analysis
This tool is valuable for digging deeper into customer needs and desires. It can unearth latent needs that consumers themselves might not be explicitly aware of, providing an opportunity for innovation and differentiation in the marketplace.
Risk Reduction in New Product Launches
Launching a new product is inherently risky. Conjoint analysis reduces this risk by providing empirical data on how likely a product is to succeed in the market. This data-driven approach can inform go/no-go decisions and guide investment in new product development.
Popular tools
The tools below will help you with the Conjoint Analysis play.
-
Conjoint.ly
Can help narrow down feature selection, marginal willingness to pay, price elasticity of demand, pricing your products
-
Conjoint Survey Design Tool
A free tool created in 2014, supplied by Harvard
-
SurveyGizmo
Survey tool that includes a conjoint analysis tool
-
1000 minds
Scientifically used Conjoint analysis tool.
Real life Conjoint Analysis examples
IMS Health
IMS Health regularly uses conjoint analysis to evaluate the importance of a product’s attributes to consumers. For a pharmaceutical product such as a drug, attributes may include price, dosing, efficacy, and side effects, among others.
Source: Conjoint analysis to understand preferences of patients...
Mariott
One of the most famous examples of conjoint analysis in marketing is the development of Marriott’s Courtyard hotel. Consultants used conjoint analysis to collaborate with stakeholders, designers, and customers in developing a list of potential features for the hotel, focusing on interviewing business travelers to design the successful Courtyard hotel.
Source: Using Conjoint Analysis in Marketing Research: Benefits, Examples and More
Lifetime Products
The company extensively used conjoint analysis to determine the right pricing for a variety of consumer products, including tables, chairs, storage sheds, trailers, kayaks, and coolers, gaining strategic insights for proper pricing with retail channels.
Source: Conjoint analysis to understand preferences of patients...
T-Mobile
They utilized conjoint analysis for their market research, which was reflected in their effective advertising campaigns, such as the relatable “What’s for Dinner?” Super Bowl commercial. This analysis helped them understand their target audience’s thought processes, decision-making factors, and the trade-offs they are willing to make for products.
A collection of 60 product experiments that will validate your idea in a matter of days, not months. They are regularly used by product builders at companies like Google, Facebook, Dropbox, and Amazon.
Get your deck!Related plays
- Conjoint analysis
- Things You Need To Know About Conjoint Analysis by Pestle Analysis
- Conjoint Analysis 101 by Brett Jarvis
- Conjoint analysis in pharmaceutical marketing research by Gang Xu, Yilian Yuan
- Conjoin Analysis by Tristan Kromer
- An introduction to conjoint analysis by Cathy Heath
- Using Conjoint Analysis in Marketing Research: Benefits, Examples and More by Bryan Orme