Engineering, Product management
Kano Model
A tool used to analyze customer satisfaction of specific features by categorizing customer preferences into three categories: Must-Have, Performance, and Delighters.
Also called: Kano Analysis, Kano Theory, Kano Methodology, Kano Diagram, Kano Questionnaire, and Kano Classification
See also: Kano Analysis, Kano Roadmapping, ICE Scoring Model, RICE Scoring Model, HEART Framework, Kano Model
Relevant metrics: Customer Satisfaction, Quality, Performance, Cost, and Usability
What is the Kano Model?
The Kano Model categorises product features by how they influence customer satisfaction and dissatisfaction. For day‑to‑day prioritisation most teams focus on three primary categories:
- Must‑Be (Basic) – Expected attributes that prevent dissatisfaction but do not create delight when present (e.g., reliable brakes on a car).
- Performance (One‑Dimensional) – Attributes where satisfaction rises in proportion to performance (e.g., battery life on a phone).
- Attractive (Delighters) – Unexpected features that create delight when present but do not cause disappointment when missing (e.g., dark‑mode when it first appeared in email clients).
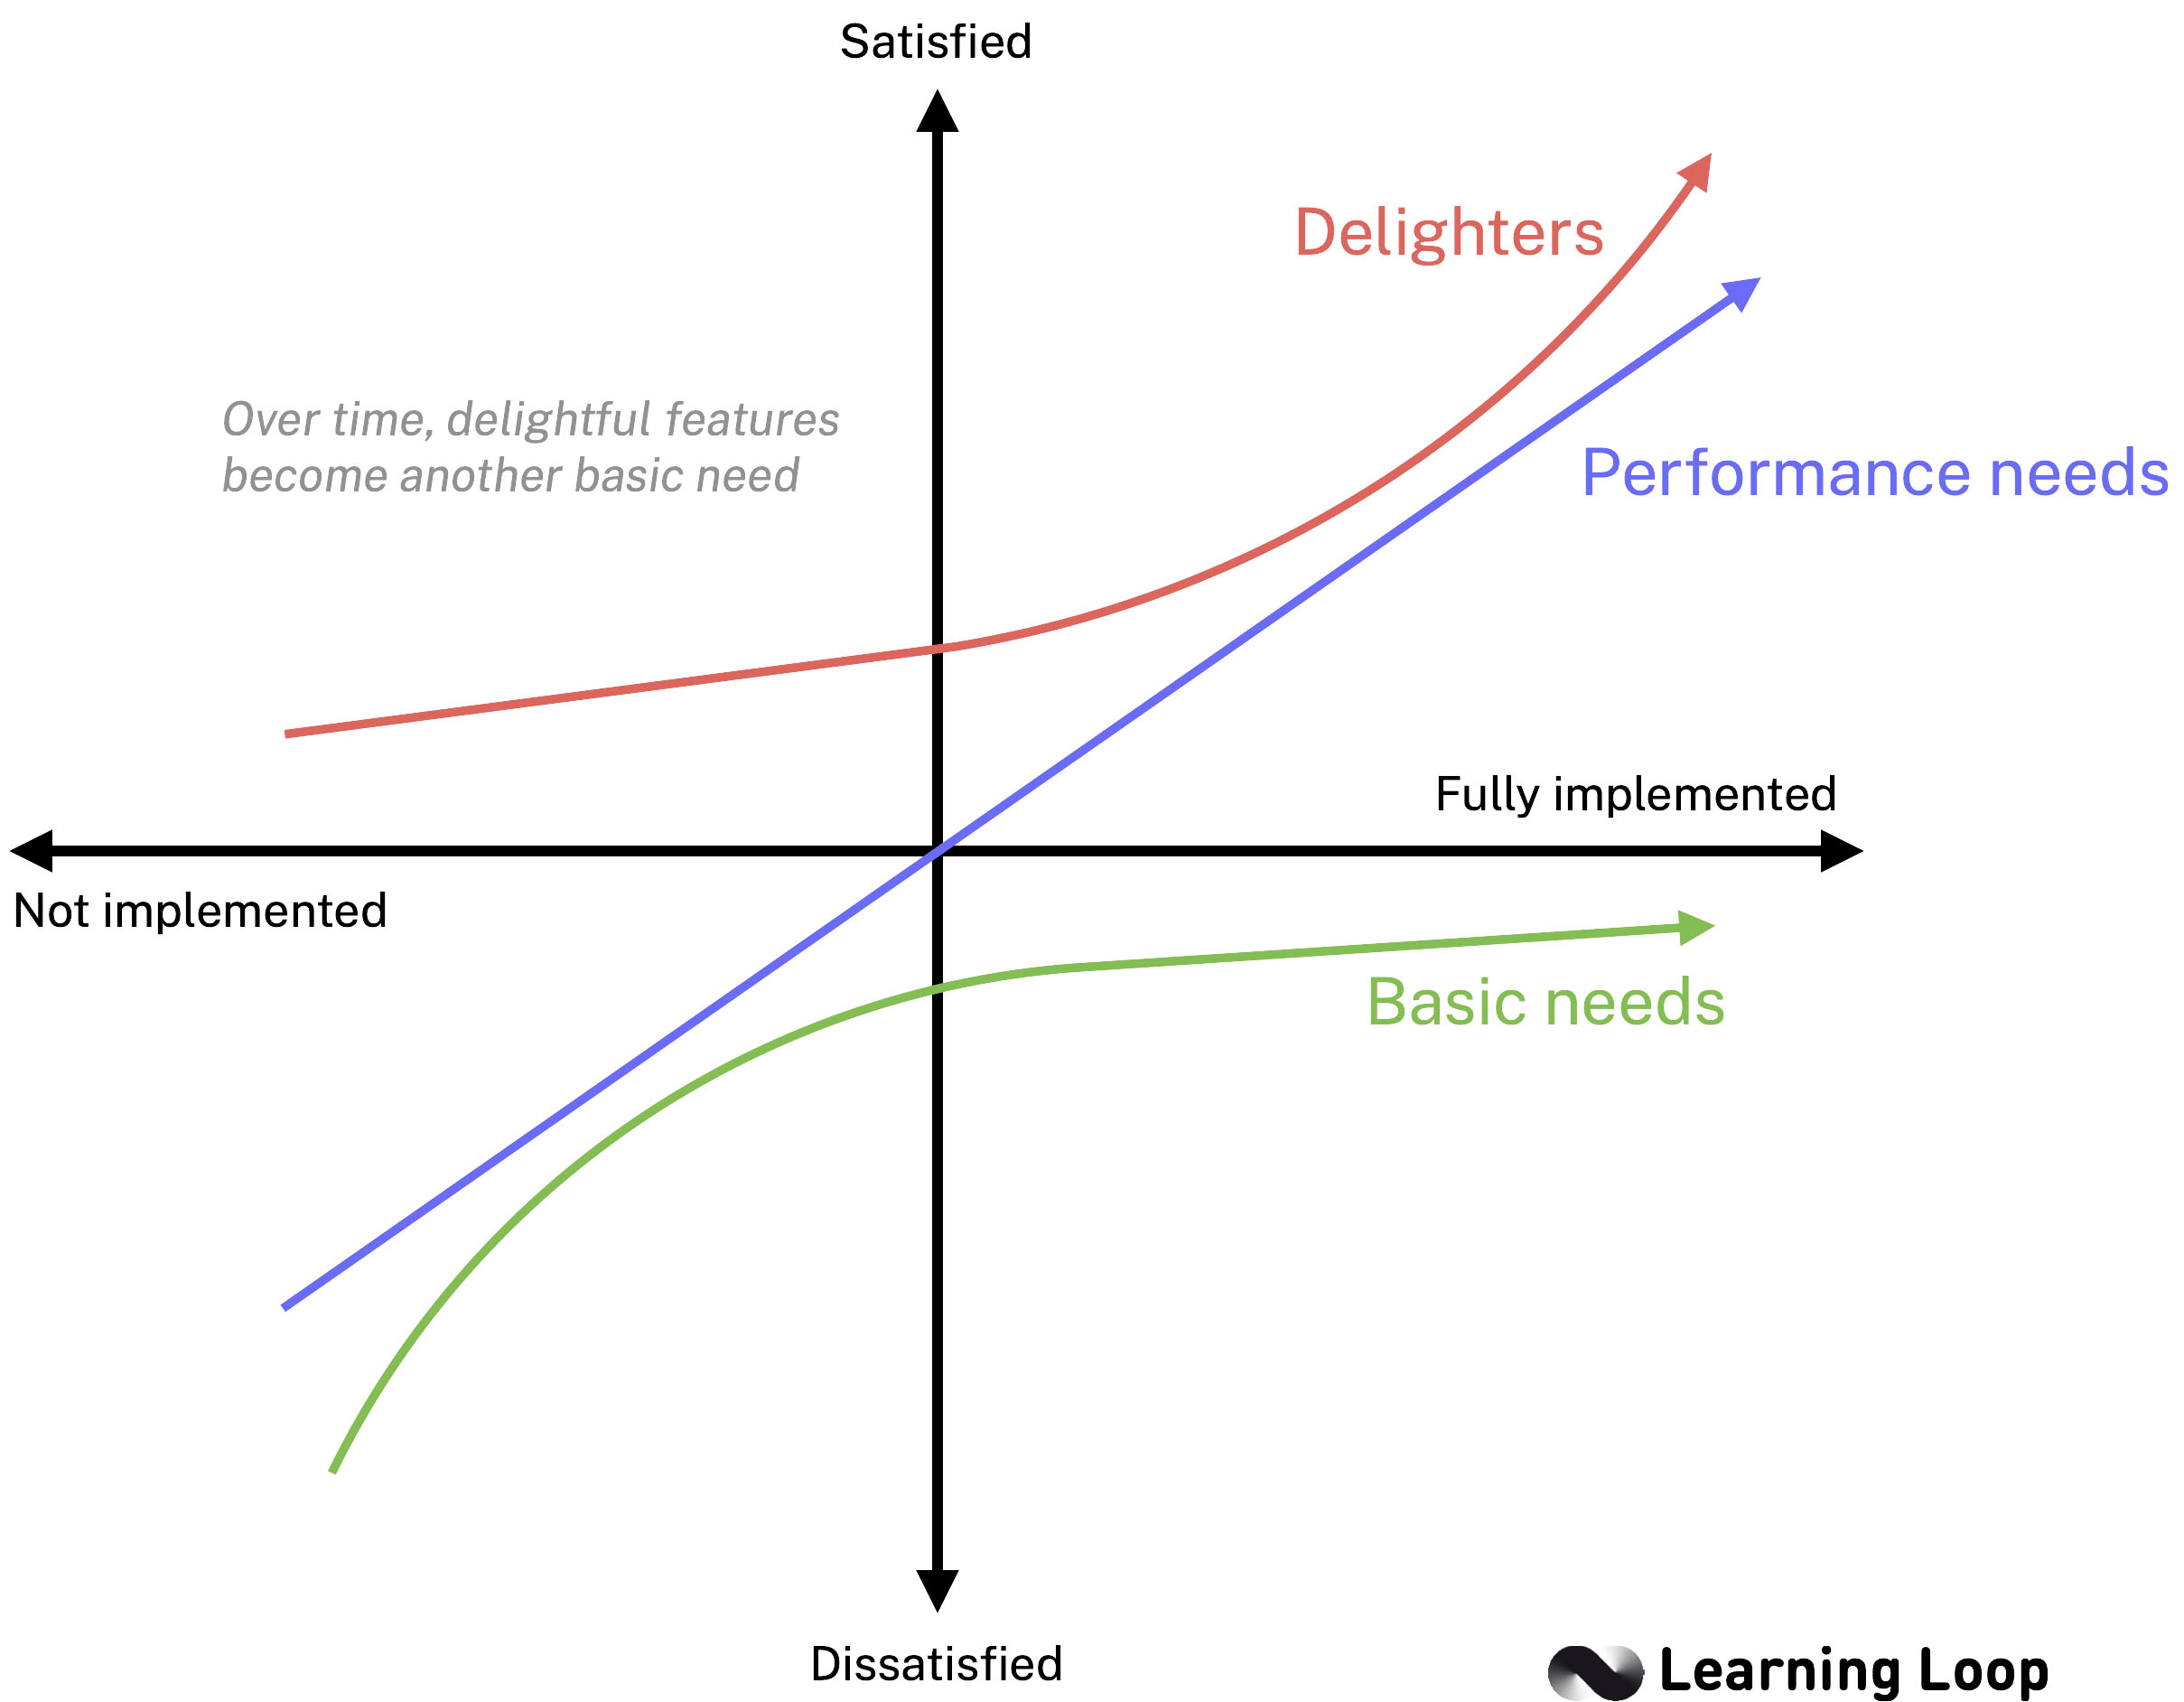
The curve on the right shows that a Must‑Be feature starts at neutral and dives into dissatisfaction if absent; adding more of it does little to improve joy. Performance features form a straight‑line relationship: the better the performance, the higher the satisfaction. Attractive features curve upward sharply—they are unnoticed when missing but deliver a leap in satisfaction when present.
Secondary categories for analysis
By classifying features into these six buckets, while focusing decisions on the first three, teams can preserve basics, fine‑tune performance factors, and sprinkle delighters to stand out. The 3 last remaining buckets are:
- Indifferent – Attributes that neither add nor subtract noticeable value for most users.
- Reverse – Attributes that please some customers but annoy others (e.g., automatic video playback).
- Questionable – Confusing responses that signal unclear survey data or misunderstood questions.
While prioritisation often revolves around must‑be, performance, and attractive features, real‑world survey data produces three additional patterns that expand the analysis and highlight wording issues or polarising attributes.
Where did Kano Model come from?
Dr. Noriaki Kano, a professor at Tokyo University of Science, introduced the model in 1984 while researching quality measurement in Japanese manufacturing. Building on Herzberg’s two‑factor theory of motivation, Kano proposed that customer satisfaction is non‑linear: some product attributes merely prevent dissatisfaction, while others actively create delight. The model gained global traction after IBM and Xerox used it to refine feature sets in the late 1980s and has since become a staple in Six Sigma, Lean, and modern product‑management toolkits.
How a Kano Analysis can be relevant in product development
Outcome‑focused product teams start with an objective: a specific change in customer behaviour that will drive a business result. Teresa Torres calls this the desired outcome and recommends exploring the opportunity space before jumping to solutions. Kano analysis fits neatly into that mindset: it helps reveal which opportunities—unmet or under‑served needs—carry the highest satisfaction upside and therefore deserve solution experiments first.
- Transforms idea discussions into outcome discussions – Once each feature idea lands in a Kano bucket, the conversation shifts from “Which solution sounds cool?” to “Which gap, if closed, moves our outcome metric?” Must‑Be gaps protect retention, Performance upgrades raise engagement, and Delighters fuel advocacy.
- Quantifies customer impact for OKRs – Closing a Must‑Be gap can decrease negative reviews; polishing a Performance attribute can lift an engagement KPI; shipping a Delighter can raise referral counts. The team can connect each potential feature to a measurable key result.
- Feeds continuous discovery – During weekly touch‑points with customers, teams can test whether an emerging idea is still a Delighter or has already drifted toward Performance. This rapid validation cycle prevents over‑investing in fading surprises.
- Pairs with opportunity–solution trees – After mapping opportunities, teams can tag each one with a Kano category to prioritise which branch of the tree to explore first. Must‑Be opportunities become guard‑rail work; Delighter opportunities become high‑risk, high‑reward bets.
- Adapts to shifting baselines – Features powered by generative AI or AR often migrate from Delighter to Performance within months. A quarterly Kano pulse keeps the roadmap aligned with rising expectations.
With Kano in the toolkit, outcome‑driven teams allocate effort where it pays off fastest—guarding basics, polishing differentiators, and seeding innovation in small, learnable bets.
Prioritising must‑have features before delighters
A common pitfall is chasing shiny Delighters while core expectations still wobble. Research shows that users penalise missing basics more than they reward extras. In practice:
- Close Must‑Be gaps first. Broken sign‑up flows, unstable performance, or missing accessibility features create friction that no amount of delight can offset.
- Elevate Performance factors next. Speed, accuracy, and reliability scale satisfaction linearly; small incremental gains compound user trust.
- Sprinkle Delighters last. When fundamentals are solid, Delighters—like playful micro‑interactions or smart AI shortcuts—create emotional lift and brand memory.
Yet innovation requires looking beyond today’s baseline. Allocate a modest slice of discovery budget to probe future Delighters. Yesterday’s dark‑mode is today’s expectation; tomorrow’s surprise may emerge from a low‑fidelity prototype tested with early adopters.
Balancing these three layers ensures the product feels dependable, competitive, and occasionally magical—all without over‑investing in features that delight nobody once the basics falter.
How feature categories shift over time
Customer expectations evolve, and today’s delighter can become tomorrow’s must‑have. The three‑point seat‑belt developed by Volvo in the 1950s illustrates this shift:
- 1950s – Delighter. When Volvo introduced the modern three‑point seat‑belt, drivers saw it as a novel safety bonus that exceeded expectations.
- 1970s – Performance. As competitors adopted seat‑belts, consumers started comparing cars on belt comfort and ease of use; better performance increased satisfaction.
- 1990s onward – Must‑Be. The seat‑belt became legally required and universally expected. A car without it would be rejected outright, decreasing value.
The lesson is clear: teams must revisit Kano classifications regularly, especially for fast‑moving digital products where delighters can normalise within months.
Kano Model examples
The table below shows how everyday feature ideas map to all six Kano categories. Use it as a thinking aid when you score your own backlog—ask whether a feature truly delights, merely adds performance, or risks annoying users.
| Feature idea | Kano category | Rationale |
|---|---|---|
| Two‑factor authentication (SaaS) | Must‑Be | Core security expectation; absence triggers distrust and churn. |
| Faster page‑load time | Performance | Satisfaction rises linearly with every speed improvement. |
| Same‑day delivery (e‑commerce) | Attractive | Exceeds baseline shipping promise and earns delight. |
| Visual search with camera (retail app) | Attractive | Unexpected convenience that boosts engagement but isn’t required to purchase. |
| Custom cursor icons on desktop web | Indifferent | Most users ignore or quickly habituate; negligible effect on satisfaction. |
| Auto‑playing video on landing page | Reverse | Pleases a minority but annoys many; risks higher bounce rates. |
| “Fun fact” pop‑up every login | Questionable | Survey responses conflict—some love the trivia, others find it pointless—signals unclear need definition. |
Remember that these labels are time‑sensitive. Auto‑suggest text once felt like a Delighter but is now a Performance baseline. Review classifications at least annually or when market signals change.
Frequently Asked Questions
What is the Kano model in simple terms?
It is a framework that groups product features into categories—must-have, performance, and delight—based on how strongly their presence or absence affects customer satisfaction.
What are the main Kano categories?
Most teams track six: Must-Be (basic), Performance, Attractive (delighter), Indifferent, Reverse, and Questionable. Prioritisation usually focuses on the first three.
What is Kano’s three-factor theory?
Kano’s original paper refers to three customer-satisfaction factors: Must-Be (threshold), One-Dimensional (performance), and Attractive (excitement). The other categories are analytical artefacts that help interpret survey noise or polarity.
What are the three levels of quality in the Kano model?
They align with the three factors: basic quality (Must-Be), expected quality (Performance), and exciting quality (Attractive). Mastering all three drives retention, engagement, and advocacy.
What are the disadvantages of the Kano model?
It requires carefully worded surveys, statistically valid samples, and frequent updates. Misclassification can mislead roadmap decisions, and the binary nature of category labels may oversimplify complex user motivations.
What are the limitations of Kano model?
Kano does not account for development cost or technical feasibility; it captures only satisfaction impact. It also assumes that user perceptions are stable during the survey period, which is less true in fast-moving markets.
How many survey responses are enough for Kano analysis?
A baseline of 30–50 responses per user segment provides directional insight; 100+ yields stronger confidence. Smaller samples risk misclassification, especially for Polarising or Questionable items.
How do I use the Kano model for roadmap prioritisation?
Start by classifying backlog ideas via a Kano survey. Fix any Must-Be gaps first, then weigh Performance and Attractive items using effort or cost scoring (e.g., RICE). This yields a roadmap that protects core satisfaction while funding innovation.
How do I accurately map features to the Kano categories?
Use clear, benefit-oriented wording in functional and dysfunctional questions, segment respondents when possible, and validate questionable results through follow-up interviews. Re-score features quarterly to catch category drift.
Can I use Kano for B2B products?
Yes, but phrase questions in business terms (compliance, ROI). Ensure the respondent understands both the feature and its context within business workflows.
How often should I rerun a Kano survey?
At least annually, or sooner when major market shifts occur—such as competitive launches, regulatory changes, or after shipping a large platform update.
Examples
Apple
Apple’s iPhone team used Kano analysis during early concept testing. Internal surveys showed multitouch gestures and visual voicemail were “Attractive” delighters, while battery life and call quality ranked as “Performance” attributes. Shipping both sets—while deferring lower-impact MMS support—helped the first iPhone launch with an NPS above 70 and set a new smartphone baseline.
Amazon Prime
Amazon leveraged Kano insights to evolve Prime. Two-day shipping scored as a “Must-Be,” but member research revealed video streaming and Kindle book lending landed in the “Attractive” quadrant. Prioritising those delighters between 2011 – 2014 raised Prime renewal rates from 82 % to 93 %.
Spotify
A Spotify roadmap workshop used a Kano survey to rank collaborative playlists, sleep-timer, and private session features. Collaborative playlists surfaced as an “Attractive” delighter and moved to the top of the queue, driving a 6 % lift in weekly social shares after launch.
-
What is the purpose of using the Kano Model?
Hint The Kano Model is a tool used to identify customer needs and preferences. It helps to prioritize customer requirements and determine which features are most important to them. -
What are the benefits of using the Kano Model?
Hint The benefits of using the Kano Model include gaining a better understanding of customer needs and preferences, being able to prioritize customer requirements, and being able to identify which features are most important to customers. -
What are the potential risks associated with using the Kano Model?
Hint Potential risks associated with using the Kano Model include relying too heavily on customer feedback, which may not always be accurate, and not taking into account other factors such as cost and feasibility. -
How will the Kano Model help me achieve my desired outcome?
Hint The Kano Model can help you achieve your desired outcome by providing a better understanding of customer needs and preferences, allowing you to prioritize customer requirements, and helping you identify which features are most important to customers. -
What data do I need to collect in order to accurately apply the Kano Model?
Hint To accurately apply the Kano Model, you need to collect data on customer needs and preferences, such as surveys, interviews, and focus groups. -
How will I measure the success of the Kano Model?
Hint You can measure the success of the Kano Model by tracking customer satisfaction and feedback, as well as the number of features that are implemented based on customer feedback. -
What resources do I need to effectively use the Kano Model?
Hint To effectively use the Kano Model, you need resources such as customer feedback data, surveys, interviews, and focus groups. -
How will I ensure that the Kano Model is applied consistently?
Hint To ensure that the Kano Model is applied consistently, you need to establish a process for collecting customer feedback and analyzing the data. You should also ensure that the same criteria are used to prioritize customer requirements.
You might also be interested in reading up on:
- The New New Product Development Game by Hirotaka Takeuchi and Ikujiro Nonaka (1986)
- A Product Developer's Toolkit by Don Reinertsen, Managing the Design Factory (1997)
- Kanban: Successful Evolutionary Change for Your Technology Business by David J. Anderson (2010)
- Kanban and Scrum Making the Most of Both by Henrik Kniberg and Mattias Skarin (2011)
- Kanban from the Inside by Mike Burrows (2014)