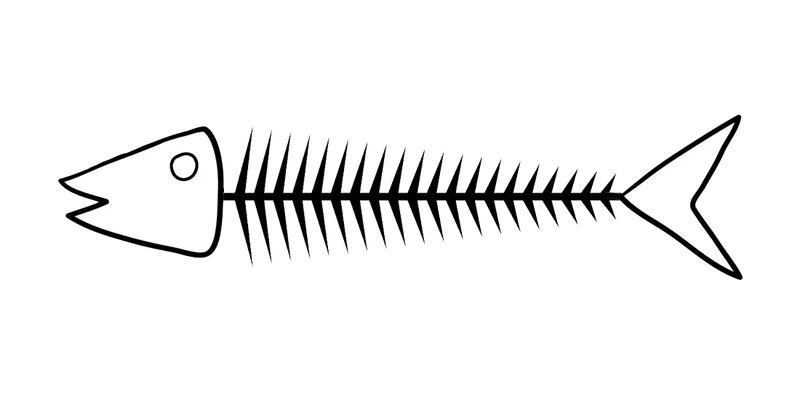
Why: Promote a holistic view of a problem space and identify possible causes for an effect or problem
When: Useful to explore root causes of a complex problem, generate insights, and facilitate discussions to address issues
A fishbone diagram organizes possible causes of a defined problem into categories so a team can investigate them. Also called an Ishikawa or cause-and-effect diagram, it helps broaden the search; the diagram itself does not establish which explanation is true.
Worked example: incomplete product setup
This product scenario and its candidate explanations are illustrative, not findings from a real investigation. A team sees new accounts failing to finish a company-details form. It groups possible explanations under four categories:
- Interface: Is the next step unclear?
- System: Is browser autofill lost when the form is submitted?
- Context: Does the problem occur under particular mobile-browser conditions?
- Measurement: Is the completion event missing even when setup succeeds?
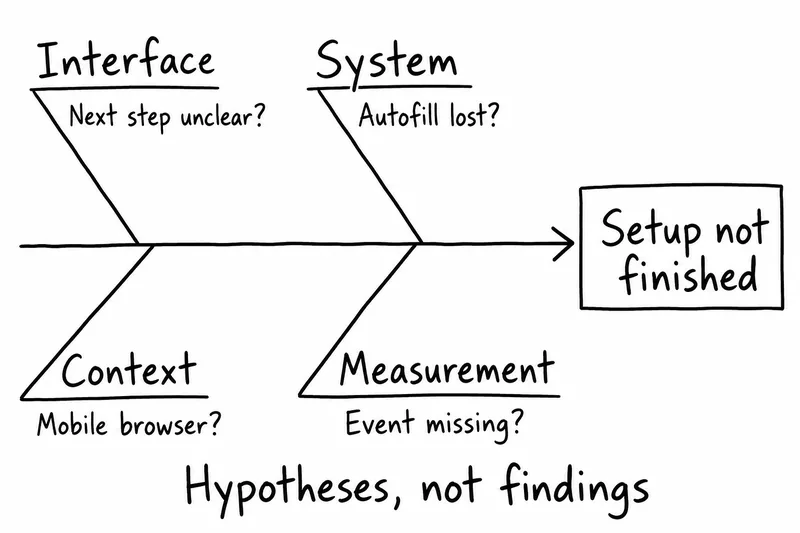
These categories fit this example; they are not a required set for every workshop. Use the map to decide what evidence to collect. For example, compare recorded completion events with saved setup states, then compare manual entry and autofill on the affected browser.
Use the Five Whys exercise to explore a promising branch without treating each answer as established fact. An Incident Timeline can rule out hypotheses that do not fit the order of events, Is / Is Not narrows the field by comparing affected and unaffected cases, and a Competing Hypotheses Matrix weighs the evidence against each remaining branch. The root cause analysis guide continues this example through evidence, corrective action and verification.
Instructions for running this play
- Prepare a problem statement before the meeting and discuss it first thing. Draw the following fishbone diagram on a large surface and place a sticky note with the problem statement in the “head”

- Discuss relevant categories of causes of the problem with the group and place a sticky note with each category at the end of each “bone”. Categories could be:
Methods, Machines (equipment), People (manpower), Materials, Measurement, Environment, Marketing - Do Silent Storming on “Why does this happen?” in a Timebox of 10 minutes. Each participant plays back their findings on the map, placing each of their sticky notes on the branch of the appropriate category. A cause can be placed on several branches.
- Again ask “Why does this happen?” in a plenum about each cause. Write sub-causes branching off the causes. Continue to ask “Why?” and generate deeper levels of causes. Layers of branches indicate causal relationships.
- When the group runs out of ideas, focus attention to places on the chart where ideas are few.
- Consider finishing off with a Who/What/When exercise or even a How Might We...
Tips to perfect this play
Master and adapt the play to fit your context and needs.
Tip: A shared understanding
Maps are for creating a shared understanding and exploring it across disciplines – between you, your team, and your stakeholders. Invite everyone relevant.
Tip: Reverse Fishbone
Start with the effect or problem and work backward to identify possible causes, challenging the team to think from a different perspective.
Tip: Multiple Fishbones
Use separate Fishbone Diagrams for different categories of causes, allowing for more focused discussions and analysis.
Tip: Follow-up with Five Whys
Consider combining with the Five Whys exercise
Every card deck includes workshop patterns, so your team can put the methods to work in your next session.
Running behavioral design workshops? The Persuasive Patterns Workshop Playbook (PDF) shows you how to design and run them.
Browse the card decks