Evaluating Onboarding Experiences
How to evaluate whether onboarding helped users reach value, reduce effort, change behavior, and reveal the missing condition

Design for behavior change with the Persuasive Patterns card decks
Apply psychological principles to influence decisions, increase engagement, and optimize user experience.
Get your deck!Why onboarding is hard to evaluate
Onboarding is hard to evaluate because teams often measure the part that is easiest to see.
They measure whether users completed a tour, clicked through a checklist, finished setup, verified an email, imported data, dismissed a modal, or reached a dashboard. These signals are useful. They show whether people moved through the designed flow. They reveal where users abandon a step, ignore a prompt, or fail to complete setup. But they do not prove that onboarding worked.
A user can complete onboarding and still not understand the product. They can reach the dashboard and still fail to reach value. They can click every tooltip and still feel unsure what to do next. They can finish setup and still configure the product badly. They can activate once and never return. They can use a feature and still misunderstand why it matters.
The visible end of onboarding is not the successful outcome of onboarding.
A tour, checklist, welcome modal, empty state, template, setup wizard, or product email may be part of onboarding, but none of these patterns is onboarding by itself. Onboarding is the early part of the user’s relationship with the product. That relationship begins before the first click and continues after the first session. It includes the expectation created by the promise, the first impression of the product, the user’s attempt to understand whether the product applies to them, the effort required to reach value, the confidence gained or lost along the way, and the reason the user has to return.
A user does not experience onboarding as a component. They experience it as the product either helping them make progress or failing to help them make progress.
The useful question is therefore not, “Did the user get through onboarding?” It is, “What changed because of onboarding?” Did the user understand the product better? Did they experience value? Did they become more confident? Did they know what to do next? Did they have a reason to come back? Did the experience make continued use more likely?
Teams often improve the measurable step while missing the meaningful outcome. More users finish the checklist, but fewer reach real value. Setup becomes faster, but confusion appears later. First-session activation improves, but second-session return remains weak. The metric moves, but the user’s relationship with the product does not.
Onboarding failure rarely has one cause. Sometimes users fail because motivation is weak. They understand the interface, but the value does not feel relevant, urgent, or worth the effort. Sometimes capability is missing. They want the outcome, but they do not know what to do, how to do it, or what good looks like. Sometimes context is wrong. They intend to act, but they lack the right information, authority, timing, device, collaborator, or moment.
A simple completion metric flattens these failures into one vague signal: users dropped off.
But users do not simply drop off. Something breaks. The product failed to make the value matter. Or it failed to make the next action possible. Or it asked for action in a moment where the user could not act.
The diagnostic shift of this chapter is to evaluate onboarding by looking for the break in progress. Did users reach value? How much effort and time did that require? Did the experience change what they did next? When the answer is weak, which condition was missing: motivation, capability, context, or some combination of the three?

Onboarding is not successful because users reached the final screen, but when the experience helps users cross the gap between arriving with a promise and continuing with a reason.
Three questions that reveal whether onboarding worked
A useful onboarding evaluation begins with three questions.
Did users reach meaningful value? Did they reach it with acceptable effort? Did the experience change what they did next?
These questions move attention away from the designed flow and toward the user’s progress. A user who finishes setup has moved through the product. A user who reaches value has moved closer to a reason to continue. A user who returns, repeats, deepens use, shares, or collaborates shows that onboarding did more than create a first impression. It changed the likelihood of future behavior.
The first question is whether users reached value. This is the moment where the product becomes relevant, useful, and worth continuing with. The product is no longer only a promise. Something has happened that makes the user believe the product can help them.
For one product, that might mean creating the first project. For another, it might mean receiving the first useful recommendation, publishing the first page, importing the first dataset, sending the first message, completing the first workflow, or creating the first shared object. In an AI product, it might mean receiving an output good enough to trust, improve, or reuse. In a collaborative product, it might mean another person comments, responds, approves, or contributes.
Activation rate can be useful, but only if activation is defined around a real value moment. If activation means “signed up,” “completed the tour,” or “reached the dashboard,” it may say little about success. If activation means “completed the first meaningful action,” “created the first useful output,” “finished the first successful workflow,” “received the first useful result,” or “created something another person engaged with,” it becomes more diagnostic.
The metric should follow the value moment, not the other way around.
Behavioral data still needs interpretation. A user may complete the action but not feel the value. They may produce an output but not understand why it matters. They may finish the first workflow but remain uncertain about whether the product is worth adopting. Sometimes the most revealing evidence is what the user believes has changed after the action. Can they describe the value in their own words? Do they understand what the product helped them do? Do they know why they would use it again?
The second question is how much effort and time value required.
A product can technically deliver value and still demand too much from the user. The user may eventually succeed, but only after confusion, repeated attempts, unnecessary setup, unclear decisions, missing defaults, long forms, or too many concepts introduced too soon. From the team’s perspective, the user activated. From the user’s perspective, the product barely earned another chance.
Value reached with too much effort is fragile.
A user who struggles for twenty minutes to reach a result may not return, even if the result is useful. A user who needs three sessions before the product makes sense may lose momentum before value becomes clear. A user who has to read documentation, contact support, ask a colleague, re-enter information, or fix repeated errors may decide that the product is powerful but too costly to learn.
Evaluation has to measure the cost of value as well as its presence. Time to first value is one useful measure. So are the number of steps before value, the number of sessions required, the error rate, the abandonment point, the amount of help needed, the number of repeated attempts, and the information the user must provide before anything useful can happen. These signals help reveal whether the product asks too much before giving enough back.
Effort is not only mechanical. It is cognitive and emotional too. A short flow can feel difficult if the user does not understand the choices. A long flow can feel acceptable if every step clearly moves them closer to something they care about. A setup process may take time, but feel worthwhile if the user understands why each action matters. Effort becomes dangerous when it arrives before confidence.
The third question is whether onboarding changed subsequent behavior.
Many evaluations stop after the user reaches value once. But first value opens the possibility of future use. It does not guarantee it. Good onboarding should change what users do next. It should make return more likely, repetition easier, understanding deeper, or collaboration more natural. In some products, it should help a behavior become recurring enough to support a habit. In others, it should help individual value expand into shared value.
Second-session return is often one of the most important early signals because it shows whether the first experience created enough reason to come back. D1, D7, and D30 retention can show whether use survives beyond the first encounter. Repeat use of the key workflow shows whether value is becoming more than a one-time event. Depth of use and feature adoption can show whether users are moving from surface exploration into more serious use.
For collaborative products, downstream behavior may include invited collaborators, shared objects, comments, assignments, approvals, or team workspace activity. For habit-forming products, it may include recurrence around the behavior that actually matters. For products with longer setup periods, it may include whether users return to complete the next stage after the initial session.
The key is to measure the behavior onboarding is supposed to make more likely. If onboarding teaches users to create a report, do they create another one? If it helps them invite a teammate, does that teammate take a meaningful action? If it helps them configure a workspace, does the workspace become active? If it introduces a core feature, does that feature become part of the user’s routine? If it promises speed, confidence, clarity, or better decisions, does the user behave as if that promise became real?
All three questions are necessary. A user who never reaches value has not been onboarded. A user who reaches value only through excessive effort may not return. A user who reaches value once but never continues may have experienced a moment, but not a relationship.
Onboarding evaluation begins to work when these questions are held together: value, effort, and subsequent behavior.
Evaluate the journey, not just the first session
A user’s first session matters, but it is not the whole story.
The first session is where the product makes its first real claim. The user arrives with an expectation, explores the interface, tries to understand the promise, and decides whether the product deserves more attention. If the first session fails completely, very little else can recover. Users who do not understand what the product is, cannot take a meaningful first action, or never experience even a glimpse of value are unlikely to return with more patience later.
But onboarding does not end when the first session ends.
Some products need to prove value within minutes. Others need a full session, a few returns, another person’s response, or enough accumulated data before value becomes visible. In these products, the first session may create orientation, intent, or setup, but not full value. The user may need to return, complete a workflow, invite someone, receive a response, build enough history, or repeat the behavior before the product becomes truly useful.
Evaluation therefore has to follow the user beyond day one.
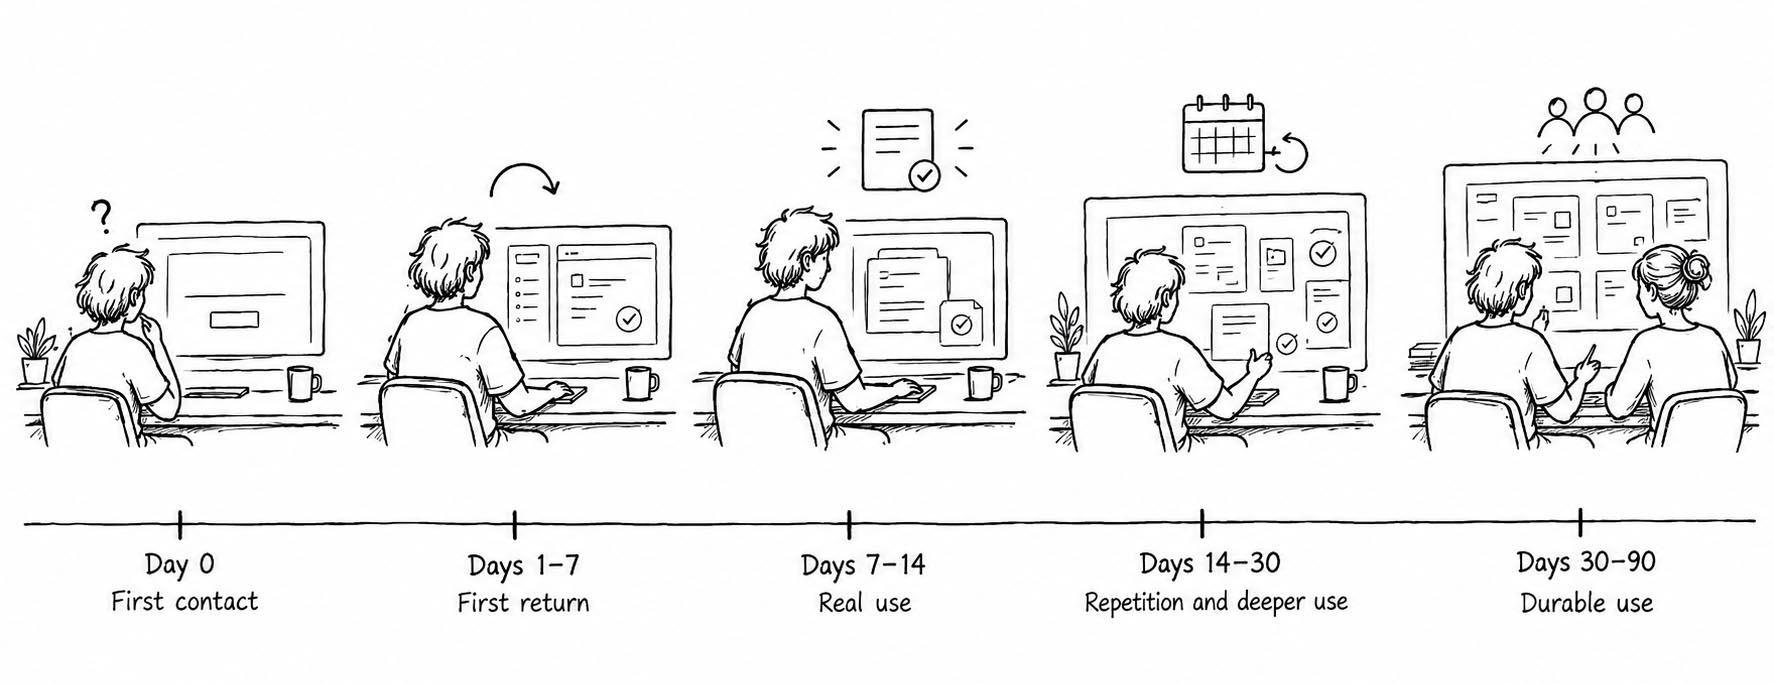
A useful way to think about this is through critical onboarding windows. These are the early periods where different forms of progress should become visible.
| Window | What it reveals | Diagnostic question |
|---|---|---|
| Day 0 | First impression, first action, first value attempt | Did the user understand the promise and make contact with value? |
| Days 1–7 | First return, early repetition, early cues | Did the first experience create a reason to come back? |
| Days 7–14 | Deeper workflow use, early commitment, first expansion | Did the user move from trying the product to using it for something real? |
| Days 14–30 | Retention, recurrence, broader adoption | Did use begin to repeat or deepen? |
| Days 30–90 | Durable use, team adoption, habit, account health | Did the early experience create conditions for continued use? |
Looking at onboarding through these windows changes the diagnosis.
If users disappear after the first session, onboarding may have failed to create enough value.
If users disappear after the second or third session, onboarding may have failed to create a return path.
If users use the product once but never deepen use, onboarding may have failed to connect first value to repeated value.
Each pattern tells a different story. A weak first session often points to a value or capability problem. The user did not see why the product mattered, or could not complete the first meaningful action. Weak second-session return often points to context. The user may have understood the product once, but nothing pulled them back at the right moment. Weak depth of use may mean that onboarding created an initial success but did not show how that success expands into a workflow, routine, or broader use case.
Retention curves are useful because they show when attrition happens. A steep drop immediately after signup suggests that the product is failing early expectations, first value, or basic usability. A drop after initial activation suggests that first value did not become a reason to continue. A gradual decline over several weeks may suggest that the product was useful once, but never became important enough to repeat.
A single activation metric cannot answer all of that. It can tell us whether a user crossed one line. It cannot tell us whether the line mattered, whether the user wanted to cross another, or whether the product became part of anything durable.
Onboarding is a journey because value often unfolds over time. The first session opens the relationship. The next session tests whether the relationship has momentum. Repeated use shows whether value is becoming real. Deeper use shows whether the product is becoming part of the user’s world.
To evaluate onboarding well, measure the arc: first contact, first value, first return, first repetition, and first signs of durable use. The question is not only whether users started. It is whether starting led somewhere.
Find the missing condition with MCC
The most common mistake in onboarding evaluation is treating every failure as the same kind of failure.
A user drops out of setup. A team sees friction. A user does not return after the first session. A team sees weak activation. A user ignores an invite prompt. A team sees a missed growth opportunity. These interpretations may be partly true, but they are too vague to guide good design. “Friction” can mean the user did not care enough to continue. It can mean they cared, but could not figure out what to do. It can mean they intended to act, but the moment was wrong.
Onboarding needs diagnosis, not measurement alone.
The MCC model gives teams a way to separate different kinds of failure. When onboarding breaks, something is usually missing in the user’s motivation, capability, or context. The user may not have enough reason to act. They may not be able to take the next step. Or the situation may not support action at that moment.
The same drop-off can point to very different problems. If users abandon setup before seeing value, the issue might be motivation: the product has not made the outcome feel relevant enough. If users repeatedly try to complete setup and fail, the issue might be capability: the product has not made the action understandable enough. If users save something for later but never return, the issue might be context: the product asked for action at a moment when the user lacked time, authority, information, or a reason to come back.
Without this distinction, teams often fix the wrong thing. They add tooltips when the real problem is weak motivation. They rewrite the value proposition when the real problem is a confusing workflow. They simplify the interface when the user actually lacks authority, data, teammates, or timing.
A compact MCC diagnosis looks like this:
| Missing condition | What it means | Common signals | Likely response |
|---|---|---|---|
| Motivation | Users do not believe the product is worth continuing with | Weak perceived value, low urgency, poor expectation fit, setup completion without return | Make value clearer, more relevant, more concrete, or better matched to the user’s goal |
| Capability | Users want the outcome but cannot complete the next action well | Confusion, errors, hesitation, support questions, repeated attempts, poor completion quality | Improve defaults, examples, guidance, templates, sequencing, or conceptual clarity |
| Context | Users intend to act, but the moment does not support action | Missing information, authority, device, collaborator, timing, or reason to return | Change timing, allow deferral, create return paths, reduce dependencies, support staged progress |
Good onboarding evaluation asks a sharper question:
What condition was missing?
Motivation problems
Motivation problems appear when users do not believe the product is worth continuing with.
The user may understand the interface. They may know where to click. They may even complete the first few steps. But the product has not created enough desire, urgency, relevance, or trust. Nothing has happened that makes the user think, “This matters for me.”
Motivation problems are easy to misread because motivated-looking behavior can hide weak motivation. A user may sign up because the landing page sounded promising, click through onboarding because the flow is short, and reach the dashboard because the product made it easy. None of that proves they care enough to continue.
The clearer signal is what happens after the required path ends. Do users return when nobody forces them to? Do they deepen use? Do they complete optional steps that would increase value? Do they invite others? Do they connect data, customize the product, create a real object, or use the product for a real task? Or do they finish setup and disappear?
Motivation problems often show up as low intent to continue, weak perceived value, low urgency, poor expectation fit, reluctance to invite others, or a quiet lack of interest. Users may say, “I understand what it does, but I don’t really need it.” They may recognize the category but not the personal relevance. They may see the feature but not the outcome.
A motivation diagnosis begins with the promise. Did the product make a clear promise? Did the user recognize that promise as relevant to their situation? Did onboarding connect the product to a problem the user already cared about? Did the experience produce a result worth continuing? Did the product match the expectations created before signup?
When motivation is missing, reducing steps may not be enough. A shorter path to a weak outcome is still weak onboarding. The product may need to make value more concrete, personalize the path around the user’s goal, bring the user’s real work into the experience, or delay lower-value setup until the user has seen why the effort is worthwhile.
Users continue because something became worth continuing.
Capability problems
Capability problems appear when users want the outcome but cannot complete the next action.
This is a different kind of failure. The user is interested. The problem is real. The promise feels relevant. But the product is too confusing, demanding, abstract, or poorly scaffolded for the user to make progress.
Capability problems leave visible traces. Users make repeated errors. They hesitate. They backtrack. They abandon setup midway. They search for help, open documentation, contact support, start tasks they cannot finish, choose workarounds, or complete an action only after multiple attempts.
Even here, teams often measure too shallowly. They ask whether the user completed the step, when they should also ask whether the user completed it well.
Completion and completion quality are not the same.
A user may finish setup but configure the product poorly. They may create a project but structure it in a way that prevents future value. They may publish a page without understanding whether it is useful. They may import data but map it incorrectly. They may invite teammates but fail to explain why those teammates were added. They may generate an AI output but not know how to judge, refine, or verify it.
In analytics, these users may look successful. In reality, they carry hidden confusion forward.
Poor completion can create delayed onboarding failure. The user appears to activate today, but weak setup makes tomorrow’s experience worse. They return to a messy workspace, irrelevant recommendations, unclear reports, empty dashboards, confused teammates, or outputs they do not trust. The product seems to have succeeded early, but the foundation is weak.
A capability diagnosis asks what the user had to understand in order to succeed. Did they know what to do next? Did they understand the terms, concepts, and sequence? Did they know what information was required? Did the product provide examples, defaults, templates, previews, or guidance? Did the user understand the consequence of their choices?
Many onboarding problems are capability problems disguised as user disinterest. The user does care, but the next step feels too hard. They want the result, but the path is unclear. They believe the product could help, but the product asks them to make too many decisions before giving them enough confidence.
When capability is missing, the answer is not always more guidance. Sometimes users need fewer concepts, better defaults, a template instead of a blank canvas, a preview before committing, or the product to do more of the work. Sometimes they need to see an example that makes the desired outcome concrete.
Some valuable products require learning. The aim is not to make every action effortless. The aim is to make the next step possible.
Context problems
Context problems appear when users intend to act and may be capable of acting, but the moment does not support action.
The user may want the outcome. They may understand the product. They may know what to do next. But they are not in the right situation to do it. They lack a file, a teammate, a manager’s approval, a quiet moment, a desktop device, a data source, a decision, or a reason to return right now.
The issue is timing and circumstance.
Context problems are common because onboarding often asks users to act as if they are in an ideal situation. The product assumes the user has time, information, authority, the right device, and the readiness to invite others, connect systems, upload data, configure settings, make decisions, or change a workflow. Users rarely arrive in such perfect conditions.
They may be exploring between meetings. They may be on mobile when the task requires desktop. They may need to ask a colleague for access. They may need approval before inviting a team. They may want to continue, but not now. They may understand the value, but the next action depends on someone else.
In analytics, these users may look like they lost interest. In reality, they hit a contextual wall.
Context problems often show up when users say they intend to return but do not. They abandon when asked for information they do not have. They postpone decisions. They stop when the product asks them to invite, configure, approve, purchase, or connect something they cannot act on alone. They switch devices before completing. They return only when a deadline, notification, assignment, or external cue gives them a reason to re-enter.
A well-designed action at the wrong moment can still fail. A share prompt after value may feel natural. The same prompt before trust has formed may feel premature. A setup step may be easy when the user has the necessary data. The same step may block progress when they do not. A reminder may be useful when it arrives near a real task. The same reminder may become noise when it arrives without a reason to act.
A context diagnosis asks whether the product respected the user’s situation. Was this the right moment to ask for the action? Did the user have the information, authority, device, or collaborator they needed? Could they save progress and continue later? Did the product create a return path? Did it remind the user when action was actually possible?
When context is missing, the solution may be to change timing rather than copy or interface. Break the action into stages. Let the user defer a step. Create a draft state. Allow progress without full setup. Ask for collaboration only after there is something worth sharing. Bring the user back when the missing dependency is resolved.
Context turns intention into action.
MCC prevents teams from treating all onboarding failure as generic friction. A user may fail to continue because the product did not matter enough, because the next action was not possible enough, or because the situation was not ready enough.
Onboarding breaks when motivation, capability, and context do not align.
Match the metric to the question
The answer to weak onboarding is not more metrics.
Many teams respond to uncertainty by adding dashboards. They track signup completion, checklist progress, email verification, tour completion, activation, retention, feature usage, support tickets, session length, invitations, referrals, and account health. Each metric may be useful in the right context, but a larger dashboard does not automatically create a clearer diagnosis. It can simply give the team more numbers to argue about.
Start with the question.
What do we need to understand? Are we trying to learn whether users reached value? Whether they could complete the next action? Whether they came back? Whether onboarding changed their behavior? Whether they understood the product?
Each question needs a different kind of evidence. A metric that is useful for one question may be almost useless for another.
Onboarding evaluation should begin with the user outcome, not the available data. First define what should have happened for the user. Then identify the signal that would show that outcome is happening. Only then choose the metric.
If the team starts with the metric, the metric quietly defines success. If it starts with tour completion, success becomes getting users through the tour. If it starts with signup completion, success becomes getting users into the product. If it starts with time on site, success becomes keeping users busy. But onboarding is trying to help users make progress.
A better sequence is:
What outcome should onboarding create? What user behavior or response would show that outcome is happening? What metric can help us observe that signal?
This turns metrics into evidence rather than decoration.
| Question | Useful signals |
|---|---|
| Did users reach value? | Activation, first meaningful action, useful output, successful workflow, shared object, perceived value |
| How much effort did value require? | Time to value, steps, sessions, errors, repeated attempts, help requests, abandonment |
| Could users complete the next action? | Task completion, completion quality, time on task, confusion, support questions |
| Did users come back? | Second-session return, D1/D7/D30 retention, return after key event |
| Did behavior change? | Repeat use, depth of use, feature adoption, recurrence, collaboration |
| Did users understand the product? | Interviews, surveys, diary studies, support themes, misconfiguration patterns |
The table is not exhaustive. It is a way of thinking. A metric becomes useful when it is attached to a question.
If the question is whether users reached value, measure evidence of value, not evidence of movement. Activation rate can help, but only if activation is defined well. A user who imports contacts may be closer to value, but has not necessarily received it. A user who creates a project may be closer to value, but the project may still be empty. A user who completes setup may be ready to begin, but may not yet have experienced anything worth returning for.
If the question is whether users could complete the next action, measure capability: task completion, time on task, error rate, setup abandonment, repeated attempts, help requests, documentation visits, and confusion signals. Completion quality matters because a user may complete a task incorrectly, configure the product poorly, publish something without knowing whether it is useful, or invite a teammate without providing context.
If the question is whether users came back, look beyond the first session. Second-session return shows whether the first experience created enough reason to continue. D1, D7, and D30 retention can show whether the product survives the user’s first few opportunities to forget it. Cohort retention can reveal whether different user types, channels, or onboarding paths lead to different patterns of return. Return should not be measured only as a generic login. Ask what brought users back and what they did when they returned.
If the question is whether onboarding changed behavior, measure what happened after first value. Depth of use, feature adoption, repeat key actions, habit-relevant recurrence, invited collaborators, shared objects, and expansion from individual to team become useful here. The point is not that every product should optimize for all of these. The point is that onboarding should make a specific future behavior more likely.
If the question is whether users understood the product, behavioral data becomes incomplete. Users can click correctly while misunderstanding the product. They can complete a flow while holding the wrong mental model. Interviews, surveys, diary studies, comprehension questions, support conversations, misconfiguration patterns, and user explanations can reveal what analytics cannot.
No single metric can evaluate onboarding by itself. A high activation rate with poor retention suggests that users reached something, but it did not create enough reason to return. Strong retention with high support volume may suggest that users value the product but struggle to use it. Fast setup with poor completion quality may suggest that the product is easy to move through but hard to understand. Many invitations with few activated invitees may suggest that the product is generating social activity without creating shared value.
Choose the smallest useful set of measures that can answer the most important questions.
Start with the outcome. Find the signal. Then choose the metric.
Use comparison to find where progress breaks
Averages can make onboarding look clearer than it really is.
A team may see that 42 percent of new users activate, 28 percent return in the first week, and 12 percent become retained after a month. Those numbers may be accurate, but they can still hide the most important part of the story. They describe what happened across all users, but not which users succeeded, which users failed, or what separated the two.
Onboarding rarely breaks evenly. Some users arrive with strong intent. Others are casually exploring. Some understand the category already. Others need more explanation. Some start on desktop with the right files, permissions, and time. Others start on mobile between meetings. Some are invited by a colleague into a specific workflow. Others arrive from a broad marketing campaign with only a vague sense of the product’s value.
When all of those users are averaged together, the team sees one activation rate, but underneath it may be several different onboarding experiences.
A cohort is a group of users who share something important. They may have signed up during the same week, come from the same acquisition channel, entered with the same role, used the same device, followed the same onboarding variant, completed the same first action, received the same invitation source, or reached value within the same time window.
Cohorts help teams stop asking, “How are new users doing?” and start asking, “Which new users are doing better, which are doing worse, and what do they have in common?”
Comparison creates diagnosis. Compare users who completed the first meaningful action with users who did not. Compare users who invited a teammate with users who did not. Compare users who started from a template with users who started from scratch. Compare users from paid acquisition with users from referral. Compare users who started on mobile with users who started on desktop. Compare users who reached value in one session with users who needed several. Compare retained users with churned users. Compare users who deepened use with users who stayed shallow.
Each comparison can reveal a possible breakpoint. If users who complete the first meaningful action retain at a much higher rate than users who do not, the team has found an important pattern. If users who start with a template are more likely to return than users who start from a blank canvas, the product may have a capability problem. If users from referrals activate more often than users from paid acquisition, the issue may be expectation fit or motivation. If mobile users abandon setup more often than desktop users, the product may be asking for actions that do not fit the device or moment.
The most useful comparisons often come from looking at extremes. Instead of asking only what new users do, ask what the best new users did that lost users did not. Did retained users reach value faster? Did they complete a specific action in the first session? Did they create something real rather than explore with dummy data? Did they invite someone? Did they receive a response? Did they come from a referral, a specific campaign, a particular role, or a clearer use case?
Then compare from the other direction. What did churned users experience that successful users avoided? Did they hit a confusing setup step? Did they start on the wrong device? Did they reach an empty dashboard? Did they skip the action that usually creates value? Did they abandon when asked for information they did not have? Did they complete onboarding but fail to understand what to do next?
These comparisons are powerful because onboarding often succeeds or fails early, before official success metrics have fully developed. The first few actions can reveal the user’s trajectory. A user who creates a real object, imports meaningful data, receives a useful output, or gets a response from a teammate may be moving toward retention. A user who browses, hesitates, starts over, skips setup, or reaches an empty state without progressing may already be drifting away.
The aim is not to find a magical activation event and force every user through it. The aim is to find early differences that deserve closer attention.
A retained user may use a feature early because the feature helps them succeed. Or they may use the feature early because they were already the kind of user most likely to succeed. A team may discover that users who invite teammates retain better, but the invitation may be a cause of retention, a signal of readiness, or both. It may create shared value. It may also reveal stronger motivation, a clearer use case, or more organizational support.
A cohort can show where the pattern is.
It cannot fully explain why the pattern exists.
Correlation is not causation, but correlation is still useful. It tells the team where to investigate. MCC helps interpret the pattern. When successful and unsuccessful users behave differently, ask what condition changed. Did successful users have stronger motivation because they arrived with a clearer problem, better expectations, or a more urgent need? Did they have greater capability because they saw better examples, understood the workflow, or avoided a confusing step? Did they have better context because they were on the right device, had the right data, had permission to proceed, or had another person ready to participate?
The difference between successful and unsuccessful users is rarely one click. It is usually a difference in readiness, clarity, effort, timing, or support.
Successful users can teach you what a good path looks like, but they may not show where the product breaks. Churned, stuck, and silent users reveal pain, confusion, and missing context, but they may not show what good onboarding should lead toward. The useful insight comes from the contrast.
Cohorts help the team find the smoke. Research helps the team find the fire.
Choose the method that answers the question
Once a team has found a weak point in onboarding, the next mistake is assuming that one method can explain everything.
A funnel can show that users abandon setup. It cannot tell you what they misunderstood. A usability test can show that users struggle with a task. It cannot show how common that struggle is across the whole user base. A survey can reveal that users did not feel value. It cannot prove what they actually did. An A/B test can show that one version performed better than another. It may still leave the team uncertain about why.
Each method sees a different part of the onboarding problem.
A simple way to sequence the work is:
Analytics tells you where users are struggling. Research helps you understand why. Experiments help you test whether a change improves the outcome.
Analytics and funnels are useful when the team needs to see how users move through onboarding at scale. They can show where users drop off, how long steps take, which actions are completed, which paths correlate with retention, which cohorts behave differently, and which onboarding variants appear to perform better. Analytics gives the shape of the problem. It does not fully explain the experience behind the behavior.
Usability testing is useful when the team needs to understand whether users can complete the steps onboarding asks them to take. It is especially valuable for diagnosing capability problems. A usability session can reveal whether users understand the interface, whether the copy makes sense, whether the sequence feels logical, whether the product asks for too much too soon, and where confusion enters the experience. It can also reveal completion quality: a user may technically complete a task while carrying wrong assumptions forward.
Diary studies are useful when onboarding unfolds over days or weeks. Some problems cannot be understood in a single session. A user may understand the product on day one, but fail to remember why it mattered on day three. They may complete the first action, but never find a natural moment to return. They may intend to use the product again, but real work does not create the opportunity. Diary studies help teams see whether the product fits into the user’s real context.
Surveys and feedback help teams understand perception. They can reveal whether users felt value, whether the product matched expectations, whether the experience felt easy or confusing, why users came, why they left, what seemed useful, and what felt unnecessary. But feedback should complement behavior, not replace it. A user may say setup was easy and still never return. Another may complain about effort but continue because the value is strong. When perception and behavior disagree, there is usually something worth investigating.
Experiments are useful when the team has a clear hypothesis and wants to know whether a change improves a specific outcome. An A/B test can compare two onboarding variants, such as introducing guidance earlier, delaying a collaboration prompt, reducing setup steps, or changing the empty state. Experiments are valuable because onboarding design involves tradeoffs. More guidance may increase completion but reduce exploration. Shorter setup may reduce friction but weaken configuration quality. The experiment should measure downstream behavior, not only immediate clicks.
Concept and prototype testing can prevent teams from overbuilding the wrong solution. Many onboarding interventions are attempts to solve uncertainty with interface: tours, checklists, templates, setup flows, explainers, emails, prompts, and help systems. Sometimes users need more guidance. Sometimes they need a clearer promise, a better default, a shorter path to value, a more relevant example, or a different moment entirely. A rough prototype, storyboard, landing page mockup, diagram, script, or lightweight clickable flow can reveal whether an onboarding idea makes sense before the team invests in polished implementation.
No single method can explain onboarding on its own. Analytics can show that users abandon the setup step. Usability testing can show that the step is confusing. Interviews can reveal that the language does not match expectations. A diary study can show that users intended to return later but never found the right moment. An experiment can show whether a new sequence improves first value and second-session return.
The method is not the point. The question is the point. The method is useful when it helps the team answer it.
Do not solve every onboarding problem at the UI level
Not every onboarding failure happens at the same level.
A user gets stuck, and the team assumes the interface needs more explanation. They add a tooltip, tour, checklist item, or revised label. Sometimes that helps. Often, the user was not stuck because they could not find the button. They were stuck because they did not understand the workflow, did not see why the action mattered, or could not act because of a dependency outside the interface.
When every onboarding problem is treated as a UI problem, teams solve too low in the experience.
A user may know where to click and still not know what to do. They may know what to do and still not know why it matters. They may know why it matters and still be unable to proceed because they lack authority, data, permission, timing, or another person’s participation.
It helps to evaluate the level at which onboarding is breaking.
Interface-level failure happens when the user does not know where to click, what a control does, how to navigate, how to complete a form, where to find a feature, or what a label means. This is usually a capability problem. Tooltips, better labels, clearer hierarchy, sensible defaults, inline validation, progressive disclosure, and simpler navigation can help. The user needs to understand the immediate action in front of them.
Process-level failure happens when the user understands the interface but not the workflow. They know where the buttons are, but they do not understand the sequence, required inputs, decisions, dependencies, or next step. This is often a capability problem and sometimes a context problem. Examples, templates, guided setup, previews, sample data, recommended next actions, and explanations of sequence can help.
Meaning-level failure happens when the user can use the product but does not understand why it matters. They may navigate, complete tasks, and reach the end of the onboarding flow, but the experience has not changed their belief about the product. This is usually a motivation problem. The product may need a stronger first value moment, more relevant examples, better expectation setting, clearer positioning, or a path that begins with the user’s goal rather than the product’s features.
System-level failure happens when the user does not understand how their use fits into a larger system of people, permissions, workflows, data, decisions, or external constraints. The product is asking the user to act within a wider environment. They may need a manager’s approval, a teammate to respond, data from another system, permission to invite others, or clarity around what happens when something is shared. This is often a context problem, especially in collaborative, team-based, or workflow-heavy products.
These levels explain why some onboarding improvements do little. A team adds tooltips, but users still do not return because the product never became meaningful. A team simplifies setup, but users still fail because they do not understand the workflow. A team improves the checklist, but invited teammates ignore the product because they lack context. A team shortens the first session, but users still disappear because no return path exists.
Interface-level problems need clarity. Process-level problems need structure. Meaning-level problems need relevance. System-level problems need context.
The levels often overlap. A confusing workflow may weaken motivation. Poor meaning may make normal effort feel excessive. Missing context may look like a capability problem. But separating the levels helps teams avoid fixing everything with UI instruction.
A tooltip can help a user understand what to click.
It usually cannot fix weak motivation, unclear value, missing authority, poor expectation fit, social dependency, or a workflow the user does not yet understand.
Build an onboarding diagnostic scorecard
At some point, onboarding evaluation has to become practical enough for a team to use.
The goal is not to create a rigid scoring system where every onboarding experience receives a neat grade. Onboarding depends too much on product type, user intent, business model, and context for that. A lightweight consumer app, a B2B analytics platform, a collaborative workspace, and an AI assistant will not all have the same path to value. They should not be judged by the same checklist.
But teams still need a way to organize evidence.
A diagnostic scorecard helps because onboarding problems are easy to discuss in fragments. One person points to drop-off. Another mentions support tickets. Someone else brings up activation. A researcher quotes a user who felt confused. A product manager talks about retention. A designer notices that users skip a key step. Each signal may be true, but without shared structure, the conversation becomes scattered.
A good scorecard does not replace judgment. It gives judgment somewhere to land.
It should help the team answer five kinds of questions: did users reach value, how much effort did it take, what happened after onboarding, which MCC condition was missing, and how strong the evidence is.
| Diagnostic area | Core question | Evidence to look for |
|---|---|---|
| Meaningful value | Did users reach something worth continuing with? | First value reached, meaningful action, useful output, successful workflow, perceived value, next action after value |
| Effort and friction | Was the path to value reasonable? | Time to value, steps required, hesitation, errors, repeated attempts, setup abandonment, help requests |
| Behavior after onboarding | Did onboarding change what users did next? | Second-session return, repeat key action, depth of use, feature adoption, invited collaborators, recurring use |
| MCC diagnosis | Which condition was missing? | Motivation signals, capability signals, context signals, drop-off patterns, qualitative explanations |
| Evidence quality | How confident are we in the diagnosis? | Behavioral data, qualitative research, cohort comparison, segment clarity, correlation vs. causation |
The first area is value. If users never experience value, then speed, completion, engagement, and return become harder to interpret. A fast path to no value is not good onboarding. A completed setup that produces no useful result is not good onboarding. A beautiful first-run experience that ends before the product becomes relevant is not good onboarding.
The second area is effort. Some valuable products require setup, learning, configuration, or commitment. Effort is acceptable when the user understands why it matters and can feel progress along the way. It becomes dangerous when it arrives before value, feels unexplained, or exceeds the user’s confidence. The scorecard should include visible friction, such as errors and abandoned steps, as well as hidden friction, such as uncertainty, hesitation, low confidence, shallow completion, and poor configuration quality.
The third area is behavior after onboarding. This is where the team learns whether onboarding created momentum. Did users return? Did they repeat the key action? Did they deepen use? Did they adopt the features that matter? Did they invite others? Did the product enter a recurring routine? The right behavior depends on the product, but the principle is the same: the scorecard should reflect the behavior that proves onboarding mattered.
The fourth area is MCC diagnosis. The team should translate evidence into a hypothesis about what was missing. If motivation was missing, users did not care enough to continue. If capability was missing, users wanted the outcome but could not complete the next action well. If context was missing, users intended to act and may have been capable of acting, but the moment did not support the action.
The final area is evidence quality. Teams need evidence, but they also need to understand how strong that evidence is. Do we have behavioral data? Do we have qualitative evidence? Do we have cohort comparisons? Do we know which user segment this applies to? Do we know whether the pattern appears once or repeatedly? Do we know whether an early behavior is likely causing retention or merely correlating with it?
The scorecard should make room for uncertainty. A team should be able to say, “We know users are dropping here, but we do not yet know why,” or “We suspect this is a context problem, but we need to speak with users before redesigning the flow.” A diagnosis that admits uncertainty is better than a confident guess.
The value of the scorecard is that it changes the team conversation. Instead of saying, “Activation is down,” the team can say, “Users are reaching the dashboard, but not first value.” Instead of saying, “The setup flow has friction,” the team can say, “Users are motivated, but lack capability to complete configuration well.” Instead of saying, “People are not inviting teammates,” the team can say, “The invitation appears before users have enough confidence or context.”
That is a more useful conversation.
A good onboarding evaluation does not only report what happened.
It explains what condition was missing.
Common ways onboarding evaluation misleads teams
Even with good intentions, onboarding evaluation can drift toward the wrong conclusions. Completion looks like success. Drop-off looks like friction. Early activation looks like progress. A retained cohort looks like proof. A confident interview quote looks like truth. Each signal may be useful, but each can mislead when interpreted too quickly.
| Mistake | Why it misleads |
|---|---|
| Measuring completion instead of value | Users can finish the flow without reaching anything worth continuing with. |
| Treating all drop-off as friction | Users may leave because of weak motivation, missing capability, or poor context. |
| Optimizing for short-term activation only | First-session gains can weaken later understanding or retention. |
| Using averages that hide segments | Different roles, channels, devices, and use cases may have different onboarding failures. |
| Confusing correlation with causation | Early behaviors may cause retention, or simply reveal users who were already likely to retain. |
| Asking only users who succeeded | Successful users may have advantages that stuck or churned users lacked. |
| Relying only on analytics or interviews | Data shows patterns; research explains experience. Both are needed. |
The strongest evaluation combines scale with interpretation: data to find the pattern, research to understand the experience behind it, and follow-up measurement to see whether the intervention worked.
How to run an onboarding evaluation
An onboarding evaluation should be practical enough to guide action. The aim is not to produce a large research report, a complicated dashboard, or a list of disconnected findings. The aim is to help the team understand where the user’s progress is breaking and what should change next.
-
Define the value moment. What should the user be able to do, understand, create, complete, or experience? What moment makes the product feel useful enough to continue with? This should be more specific than signup, setup completion, or reaching the dashboard.
-
Define the critical onboarding window. Does value need to appear in minutes, one session, one week, or several returns? A collaboration product may not show its full value until another person participates. A data product may need enough information before it can produce insight. The window should match the way value appears.
-
Map the journey. Identify what must happen before, during, and after value. What decisions, dependencies, permissions, data, examples, explanations, or collaborators are involved? The purpose of the map is not to document every screen. It is to understand the sequence of progress.
-
Instrument the key events. Track progress signals, not activity alone. Measure activation, time to value, completion quality, errors, abandonment, return, repeat use, and any expansion behavior that is relevant to the product. In collaborative products, this may include invitations, accepted invites, first shared objects, comments, assignments, approvals, or teammate activity.
-
Segment users into cohorts. Compare users by channel, role, device, company size, use case, onboarding version, first action completed, invitation source, pricing plan, or retention outcome. Cohorts turn a general onboarding problem into a more specific one.
-
Find the breakpoints. Look for where users stop, slow down, repeat steps, make errors, ask for help, complete a task but fail to continue, or reach value but not return. Breakpoints can appear before value, during value, or after value. A user who never reaches value has a different problem from a user who reaches value once and never returns.
-
Diagnose with MCC. Ask whether the issue is motivation, capability, context, or some combination. If users understand the product but do not care enough to continue, the problem may be motivation. If users want the outcome but cannot complete the next action, the problem may be capability. If they intend to act but cannot act at that moment, the problem may be context.
-
Use research to understand why. Match the method to the question. Usability testing can reveal where users get confused. Interviews and surveys can reveal whether value feels relevant and expectations were met. Diary studies or follow-up interviews can reveal what happened after the first session, why users intended to return but did not, and what external dependency blocked progress.
-
Design the intervention. Match the intervention to the missing condition. If motivation is missing, clarify the promise, make value more concrete, personalize the path, improve expectation fit, or move users toward a stronger first result. If capability is missing, improve defaults, examples, guidance, sequencing, validation, or previews. If context is missing, change the timing, add a save-and-return path, defer setup, clarify permissions, support role-based onboarding, or ask for collaboration only after value.
-
Measure downstream behavior. Do not stop at the immediate metric. A new prompt may increase clicks. A shorter setup may increase completion. A checklist may increase task progress. A template may increase first-session activation. The evaluation should ask whether the change helped more users reach value, reduced unnecessary effort, improved completion quality, increased second-session return, supported repeated use, deepened adoption, created useful collaboration, or strengthened retention.
This turns onboarding evaluation into a learning system. The team is no longer watching users succeed or fail. It is learning what users need in order to move from promise to value, from value to return, and from return to durable use.
The missing condition
The chapter comes back to three questions.
Did users reach meaningful value? Did they reach it with acceptable effort? Did the experience change what they did next?
Those questions bring onboarding back to its purpose. Onboarding is not there to move users through onboarding. It is there to help users cross the gap between interest and use, between use and value, between value and return, and between return and durable behavior.
The purpose of evaluation is not to declare onboarding good or bad.
The purpose is to find the missing condition.
When users fail to activate, return, or deepen use, something is usually missing. They may not want the outcome enough. They may not know how to reach it. Or the moment may not support the action. The problem may be motivation, capability, context, or some combination of all three.
Good onboarding evaluation gives a team more than a number. It gives a direction. More value, less effort, better timing, clearer guidance, stronger expectation fit, a better first action, a stronger second-session reason, or a clearer path from individual use to shared use.
Each version of onboarding should teach the team something about the user: what they care about, what they misunderstand, where they hesitate, what they can do alone, what they need from others, what brings them back, and what makes value stick.
That learning is the real output.
Good onboarding evaluation helps teams see the distance between the product’s promise and the user’s continued behavior. When teams can name what is missing, they can stop guessing at onboarding improvements and start designing the next version with intent.
- User Onboarding and the First Moment of Real Value by Anders Toxboe at Learning Loop
- A Behavioral Model of User Onboarding by Anders Toxboe at Learning Loop
- User Onboarding Beyond Day One by Anders Toxboe at Learning Loop
- Stop Designing Paths. Start Designing Platforms. by Anders Toxboe at Learning Loop
- Evaluating Your New User Experience by Krys Higgins at Krys Higgins
- Levels of User Onboarding by Krys Higgins at Krys Higgins
- Measuring the User Experience on a Large Scale: User-Centered Metrics for Web Applications by Kerry Rodden, Hilary Hutchinson, and Xin Fu at Google Research
- Design Fidelity and User Testing at Intercom
- When to Use Which User-Experience Research Methods by Christian Rohrer at Nielsen Norman Group
- Measure User Onboarding at Amplitude
- New User Retention at Amplitude
- Product Analytics Can Help Predict Retention at Mixpanel