Root Cause Analysis
A structured investigation of why a problem occurred and which conditions need to change to reduce its recurrence
Root Cause Analysis at a glance
- Type
- Method
- Also called
- RCA and Root Cause Investigation
- Metrics
-
3 relevant metrics to track
- Recurrence of the defined failure
- Completion rate for the affected cohort
- Time to detect and resolve the problem
Root cause analysis (RCA) is a structured investigation of why a problem occurred and which underlying conditions need to change to reduce its recurrence. It connects observations, possible explanations, supporting evidence and corrective action.
A drop in setup completion describes a problem; it does not explain it. Customers might be confused, a form might fail, or the measurement might have changed. Choosing an explanation too early can produce a well-executed fix for the wrong problem.
ASQ describes RCA as a family of approaches and tools. The 5 Whys and fishbone diagram can support an investigation, but neither turns a plausible story into an established cause by itself.
Symptoms, hypotheses, causes and actions
Keep these four things separate while investigating:
| Item | What it means | Illustrative setup example |
|---|---|---|
| Symptom | The observed problem or effect | New accounts do not complete the setup form |
| Hypothesis | A possible explanation that still needs checking | Browser autofill is not being captured correctly |
| Supported causal explanation | A mechanism supported by observations and tests | The visible field is filled, but the submitted value is empty on the reproduced autofill path |
| Corrective action | A change intended to address the mechanism or its contributing conditions | Capture the submitted value correctly and test the affected input path |
“Improve onboarding” is a proposed action, not an explanation of why completion fell. “Users made mistakes” also leaves important questions unanswered: what did the interface communicate, what happened in the system, and which conditions made the problem more likely?
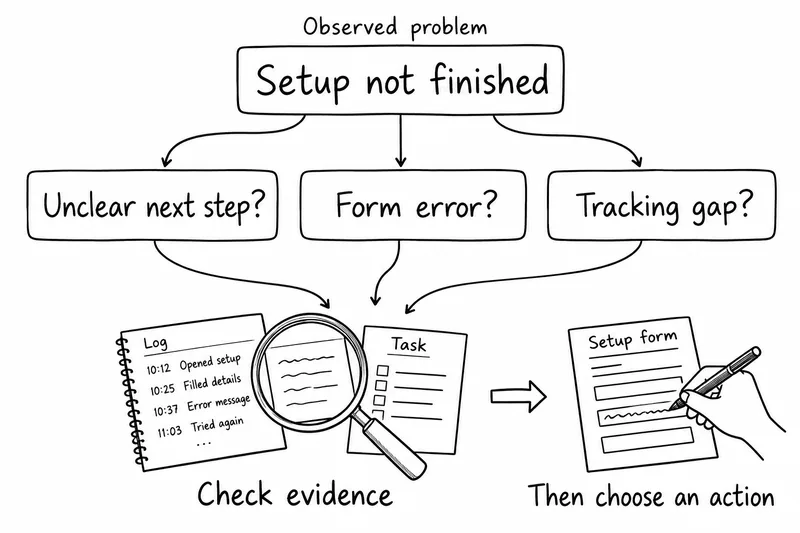
The investigation flow and log in this illustration are hypothetical. The arrows show how to investigate, not a proven causal chain.
Which root cause analysis method should you choose?
Choose the tool around the uncertainty. ASQ’s cause-analysis overview distinguishes tools that organize possible causes from tools that examine counts or relationships in data.
| Approach | Useful for | Important limit |
|---|---|---|
| 5 Whys | Following a possible explanation through several contributing conditions | A single chain can miss other branches; each answer still needs evidence |
| Fishbone diagram | Organizing several possible causes into meaningful categories | Brainstorming and voting do not verify a cause |
| Timeline or process map | Reconstructing what happened before, during and after a failure | An event occurring first does not by itself show that it caused the next one |
| Pareto analysis | Seeing which recorded problem categories occur most often | Frequency depends on the classification and data; it does not establish a causal mechanism |
| Comparison and reproduction | Checking what differs between affected and unaffected situations, then attempting the relevant path | A reproduced failure establishes evidence about those conditions, not every case in the population |
These approaches can work together. A fishbone can expose competing explanations, a timeline can constrain them, and a focused reproduction can investigate a particular mechanism. Use the Five Whys exercise to facilitate a deeper inquiry into a possible explanation, or the fishbone workshop to organize several branches. The 5 Whys glossary guide explains the technique and its limitations.
How to conduct a root cause analysis
1. Define the problem before explaining it
Write the affected behavior, who or what is affected, the conditions, the period and the impact. For a funnel metric, specify the completion event and eligible cohort. Check whether the measurement itself changed before attributing the trend to customers or the product.
“Activation is down” leaves too much open. “New studio accounts using mobile autofill receive an error on the company-details step” gives the team something observable to investigate.
2. Reconstruct the relevant facts
Bring together observations, support reports, system events, recent changes and the people who understand the work. Record the sequence and distinguish direct evidence from interpretations. Keep gaps visible rather than filling them with a confident narrative.
If customers are currently blocked, a temporary workaround may be necessary while the investigation continues. Record that containment separately from a change intended to prevent recurrence.
3. Generate competing explanations
Use a fishbone or another cause map to broaden the search. Choose categories that fit the problem rather than forcing every product issue into manufacturing categories.
Use the Five Whys exercise to probe a branch: ask what contributed to the previous condition, record the evidence for each answer, and keep unresolved links visible. Stop or branch when the evidence calls for it; reaching five answers does not establish a cause.
The Chartered Quality Institute’s cause-and-effect guidance emphasizes that the diagram organizes suspected factors that must then be tested and verified. A popular explanation is still a hypothesis.
4. Seek evidence that separates the hypotheses
Ask what you would expect to observe if each explanation were true. Compare relevant conditions, inspect the sequence, or attempt a reproduction. Look for evidence against a favored explanation as well as evidence for it.
A correlation can tell you where to look. A causal account needs a credible mechanism and evidence connecting it to the problem. State how strong that connection is and which alternatives remain unresolved.
5. Choose changes that address the supported conditions
Separate the immediate mechanism from conditions that allowed it to happen or made recovery difficult. A technical defect, an unhelpful error message and a missing test can all matter without being interchangeable explanations.
Google’s postmortem guidance focuses on contributing causes and preventive action rather than blaming individuals. In a product investigation, ask how the system, information and process can better support the people using or maintaining it.
6. Verify the action and monitor the outcome
Assign an owner, a completion date and a way to check the change. Attempt the original failure path again, then monitor the affected behavior with a consistent definition and relevant guardrails.
Closing a task is not the same as reducing recurrence. If the result does not change as expected, revisit the explanation and the implementation rather than declaring the analysis complete.
Root cause analysis example: incomplete product setup
The following product, observations and findings are illustrative. They are not results from an actual customer study or incident.
A subscription service requires a studio owner to enter company details before creating a first invoice. Its team sees fewer new accounts finishing setup. Instead of immediately redesigning the whole flow, it defines the relevant cohort and checks several explanations.
| Possible explanation | Evidence to investigate | Illustrative observation |
|---|---|---|
| The completion event is missing | Compare the recorded event with the saved setup state | The observed blocked attempts really are incomplete; an event-only explanation does not account for them |
| People cannot find the next step | Observe the task and the point where participants stop | Affected participants find and press Continue, then encounter an error |
| Autofill is not captured correctly | Compare manual entry with autofill on the affected browser and inspect the submission | The field looks populated, but the submitted value is empty on the reproduced autofill path |
In this scenario, the team can reproduce a specific failure sequence:
- The browser fills the company-details field.
- The screen shows a value, but the application does not capture it correctly for submission.
- Pressing Continue submits an empty required value.
- A generic error gives the customer little help recovering.
This supports a mechanism for the reproduced failure. It does not establish that every incomplete account has the same cause. Other customers might still encounter unclear instructions or a different technical problem.
The fishbone workshop example shows how Interface, System, Context and Measurement can organize competing hypotheses for this scenario. Those categories are adapted to the example, not required for every RCA.
From explanation to corrective action
The team separates three changes: correct the value-capture behavior, make the error recoverable, and add the missing autofill path to the relevant browser tests. It assigns an owner and verification plan to each.
After the changes, it repeats the same input path and watches completion and error rates for the affected cohort. It also checks for problems introduced in manual entry or other supported paths. A simple before-and-after increase would still need interpretation if the traffic, cohort or measurement changed at the same time.
A simple RCA report structure
A useful report preserves the reasoning needed to review the decision:
- Problem and scope: the effect, affected population, conditions, period and impact.
- Evidence: observations, event sequence, relevant changes and known gaps.
- Competing explanations: what was investigated, supported, weakened or left unresolved.
- Causal account: the supported mechanism and contributing conditions, with confidence limits.
- Actions: what will change, who owns it and when it will be checked.
- Verification: how the original failure and the wider outcome will be monitored.
The learning sheet can help distinguish observations, interpretations and next actions. It is a general learning resource, not a specialist RCA report template.
Root cause analysis vs. customer discovery
RCA starts with a defined problem or failure to explain. Customer discovery investigates people’s needs, situations and possible opportunities more broadly. The activities can inform one another, but an interview response cannot establish the technical cause of a system failure.
Use customer interviews when you need context about a confusing workflow, and a suitable prototype when you need to observe an interaction. Use technical investigation for a suspected implementation failure. Connect corrective experiments to your product experimentation plan.
Discovery Patterns supports the customer-research part of that work. It is an adjacent recommendation, rather than a claim that the deck provides an engineering incident-investigation toolkit.
Common mistakes and limitations
Stopping at the first coherent story. A persuasive explanation is not necessarily the best-supported explanation. Keep credible alternatives visible until evidence distinguishes them.
Treating a diagram as proof. A fishbone organizes ideas. A 5 Whys chain traces an explanation. Both need evidence, and a system may have several interacting contributors.
Ending with blame or a vague instruction. “Be more careful” leaves the conditions that shaped the behavior unexplained. Make the proposed system or process change specific enough to review and verify.
Forgetting the measurement. A changed event, denominator or reporting rule can resemble a changed customer behavior. Check the signal before optimizing the experience around it.
Producing a report without follow-through. Analysis supports a decision; its value depends on implementing and evaluating suitable actions. Record unresolved causes and revisit them if the failure persists.
Get a head start
The learning sheet forces you note critical factors about what you learned from an experiment and will help you ensure that you make the resulting decisions and actions explicit.
Grab the 'Learning sheet'
Visual examples
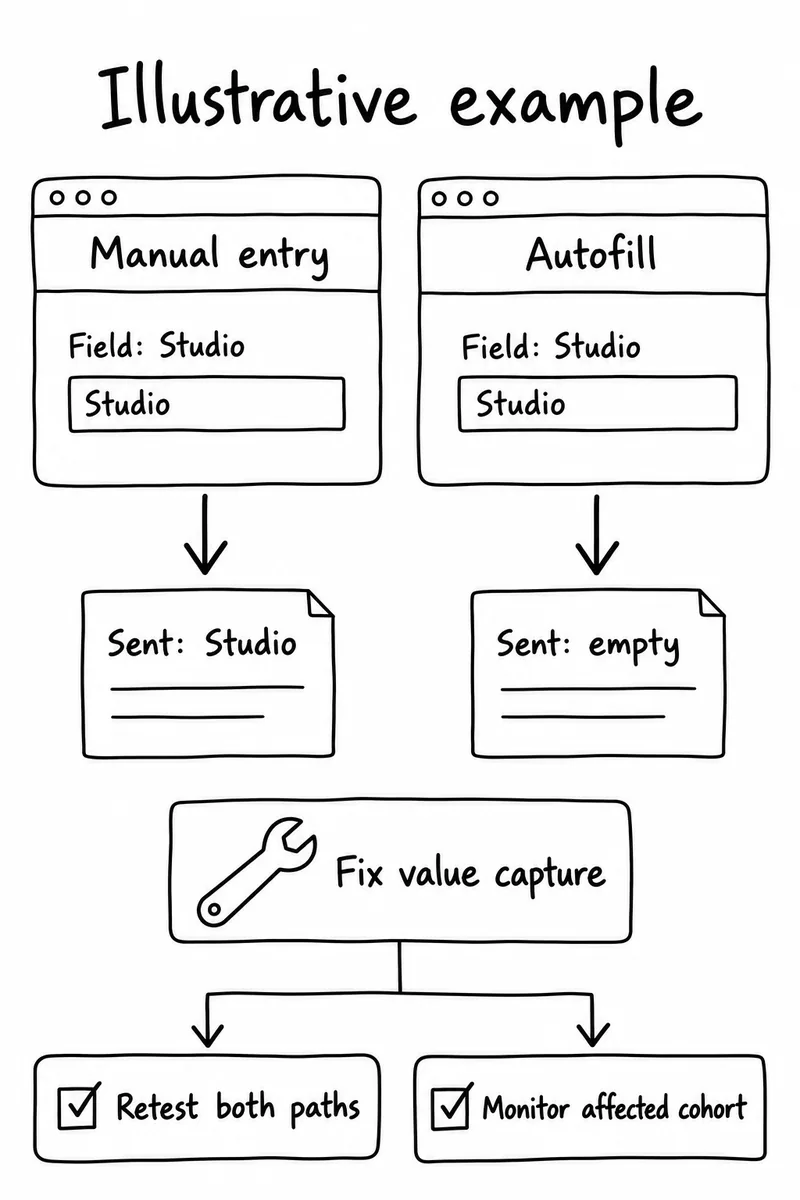
Illustrative autofill investigation: two populated fields submit different values. Correct the value capture, retest manual entry and autofill, then monitor the affected cohort.
-
What did we actually observe?
Hint Specify the affected behavior, population, conditions and period before proposing an explanation. -
What would distinguish the competing explanations?
Hint Choose observations or tests that could weaken a hypothesis, rather than collecting only confirming anecdotes. -
Is there always one root cause?
Hint No. A useful explanation may involve several interacting conditions. State the mechanism and contributors at a level where a meaningful change is possible, while acknowledging what remains uncertain. -
Do you have to ask why exactly five times?
Hint No. The name of the 5 Whys is a prompt for deeper investigation, not a rule that the fifth answer is true. Follow evidence and use additional branches or methods when a single chain is inadequate. -
How will we know whether the corrective action helped?
Hint Assign an owner, verify the original failure path and monitor the relevant outcome and possible side effects. -
When is the analysis complete?
Hint For the current decision, the team needs a sufficiently supported explanation, a proportionate action plan and a verification owner. Continue monitoring afterward; a completed document is not permanent proof that the problem cannot recur.
You might also be interested in reading up on:
- What is Root Cause Analysis (RCA)?
- Cause Analysis Tools
- Quality tool: Cause and effect diagram by Richard Green
- Postmortem Culture: Learning from Failure by John Lunney and Sue Lueder
Product Weekly · Curated by Anders Toxboe
Sign up for the Product Weekly newsletter.
Join 40,000+ product people who get a weekly selection of useful reads on building digital products, plus new Learning Loop resources and occasional product updates.
What will I receive?Takes 10 seconds. Free to subscribe, unsubscribe at any time. Privacy policy.